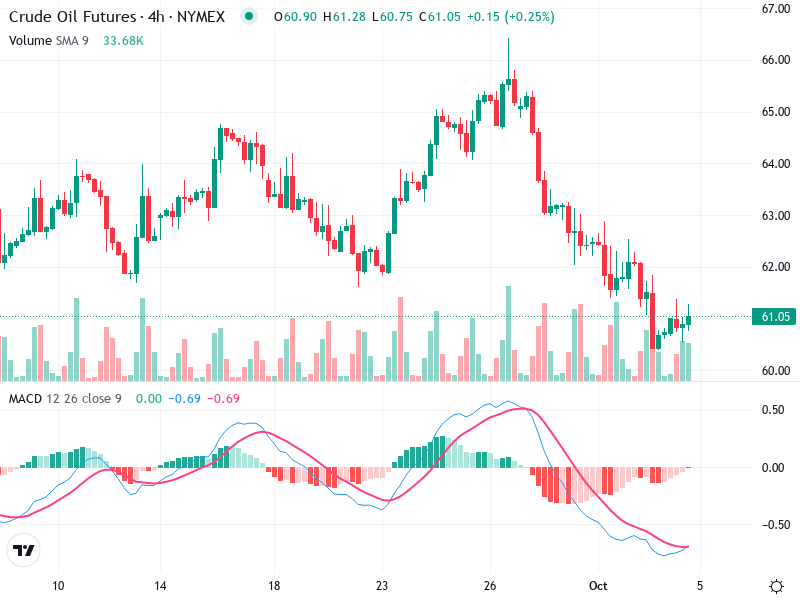
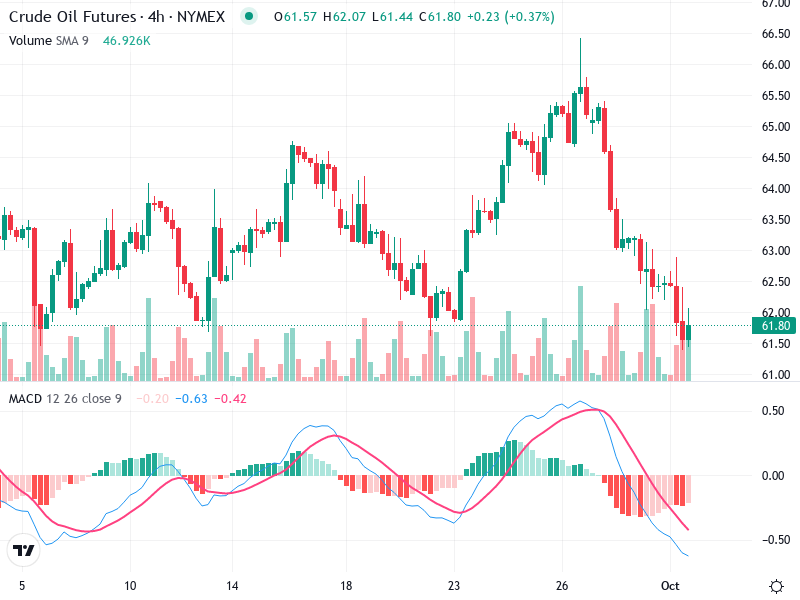
OIL – Technical Analysis – 4h
The Crude Oil Futures chart reveals a potential shift in market direction. A pattern suggesting a
The Crude Oil Futures chart reveals a potential shift in market direction. A pattern suggesting a
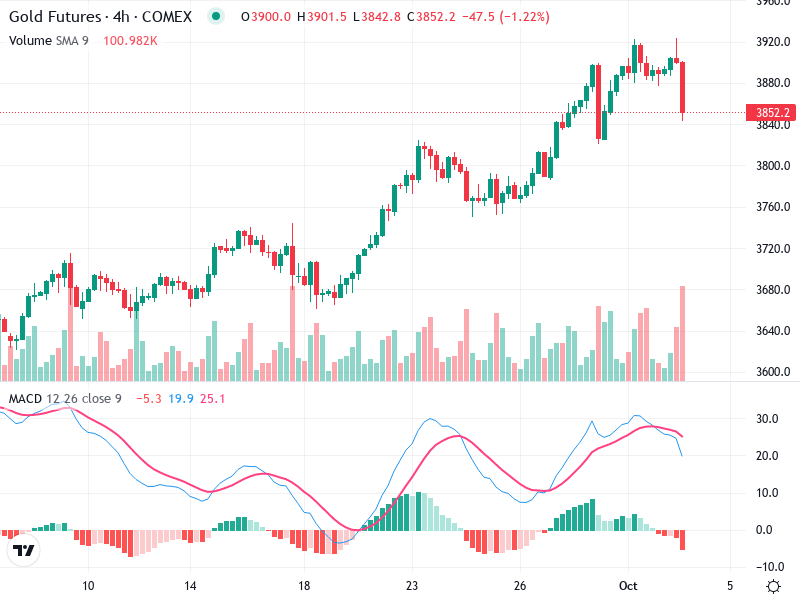
The Gold Futures 4-hour chart reveals critical insights for traders. Current market conditions indicate a potential
The chart of indicates a current downturn in market conditions, but some technical signs suggest a
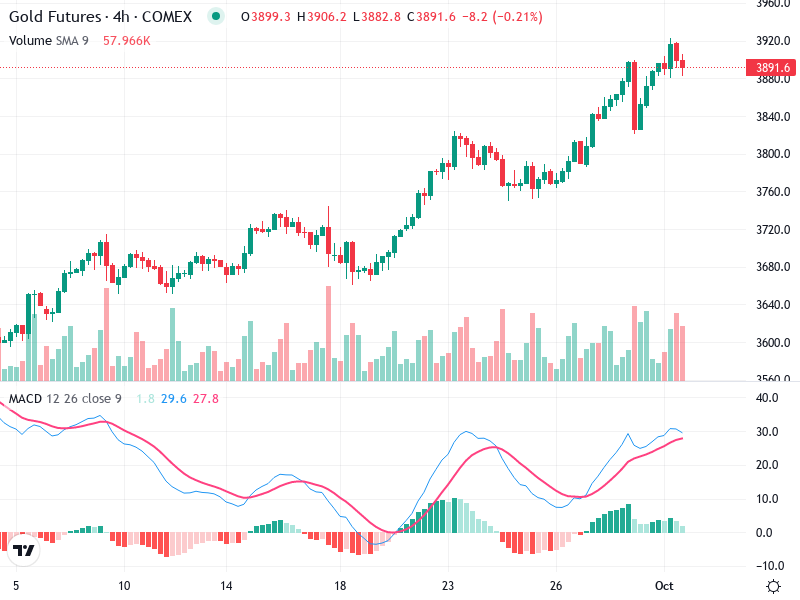
The Gold Futures 4-hour chart reveals critical insights for traders. A sequence of bullish candlestick formations
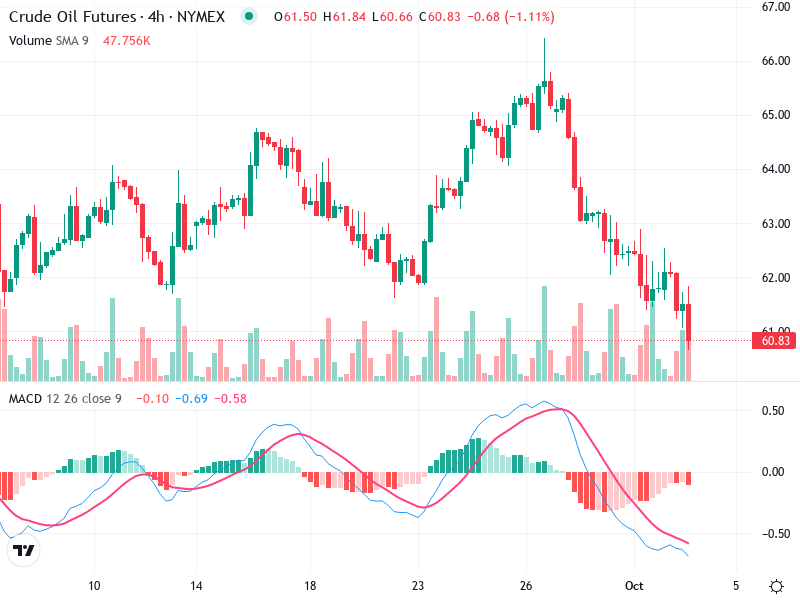
The Crude Oil futures chart analysis shows a mix of bearish and bullish elements. Prices are
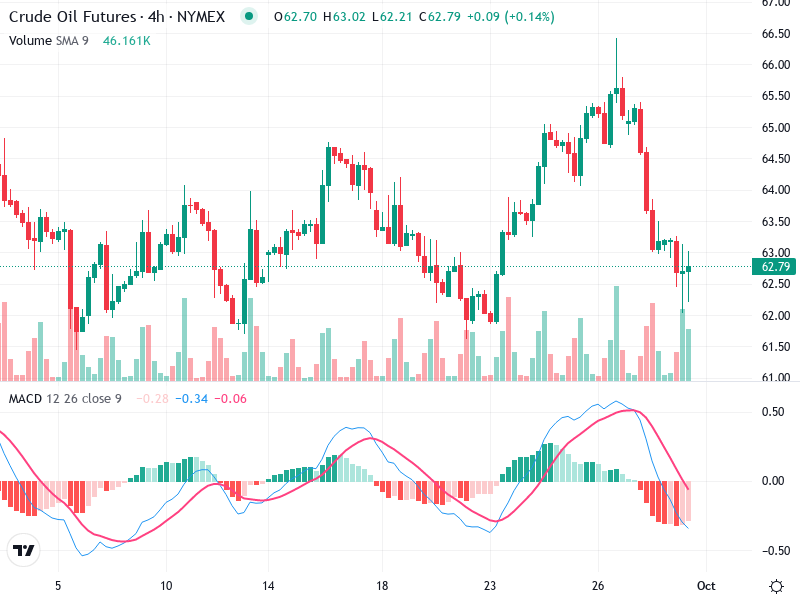
The chart for Crude Oil Futures reveals critical insights into current market dynamics. The asset is
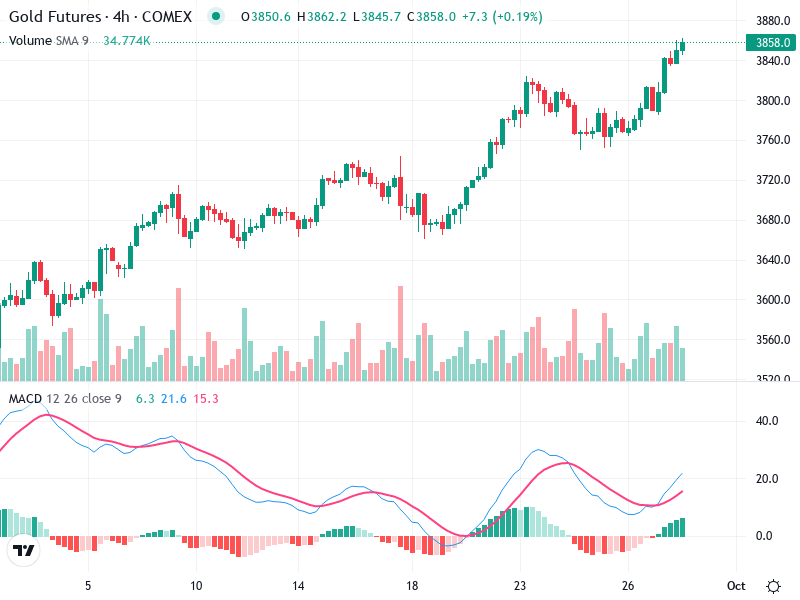
The chart shows a prominent upward trend driven by bullish candlesticks and increasing volume. demonstrates positive
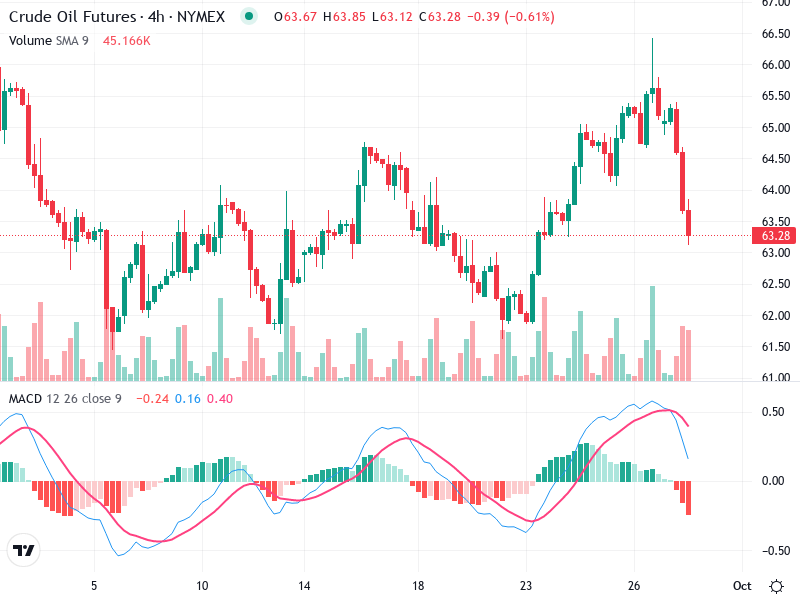
The recent analysis of ‘s chart reveals a distinct pattern. The asset is currently experiencing notable
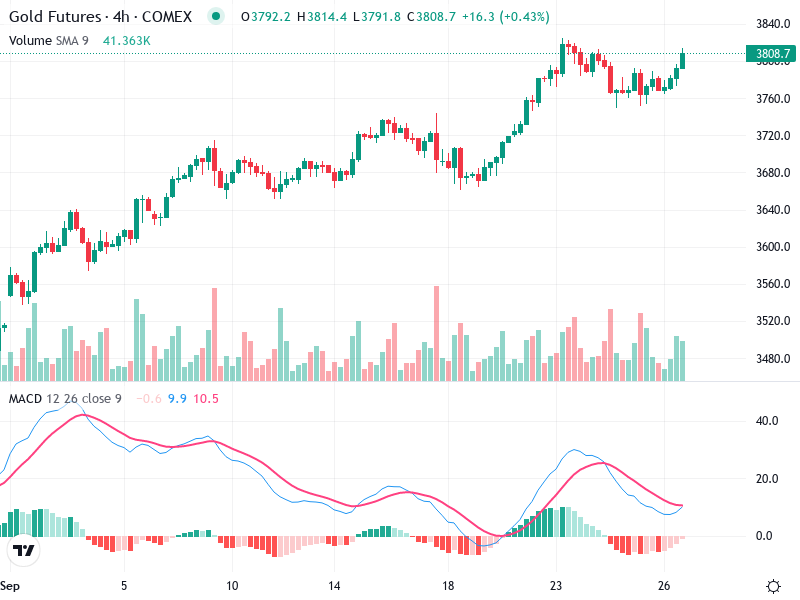
The asset is currently displaying a bullish trend characterized by higher highs and higher lows. The

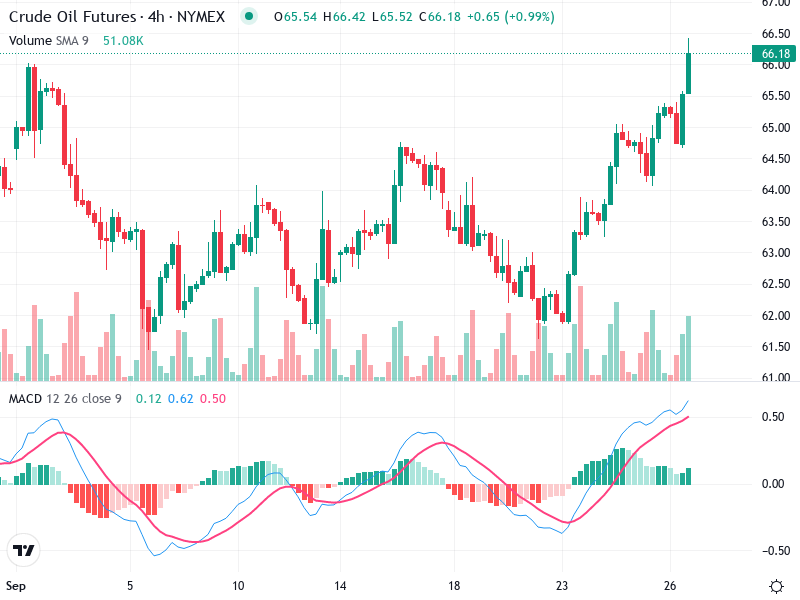
The Crude Oil Futures chart presents a strong bullish momentum. Recent breakout above key resistance levels
