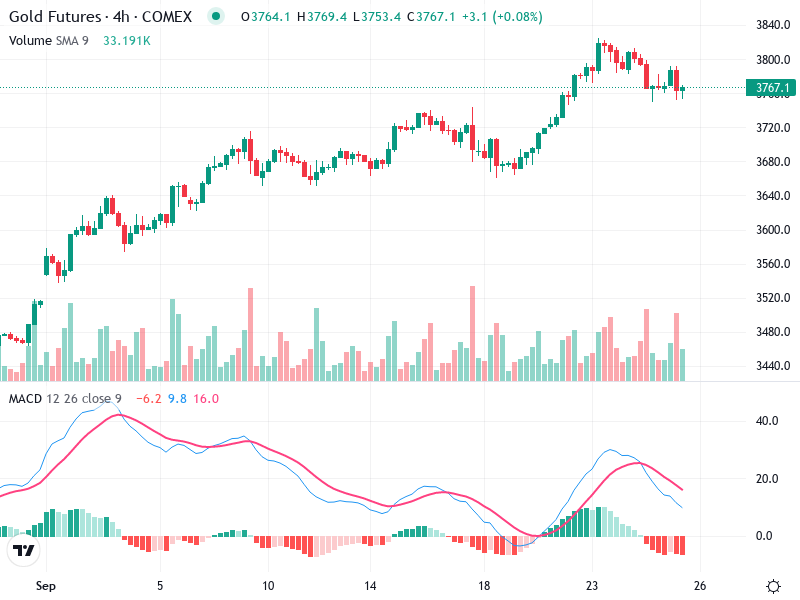
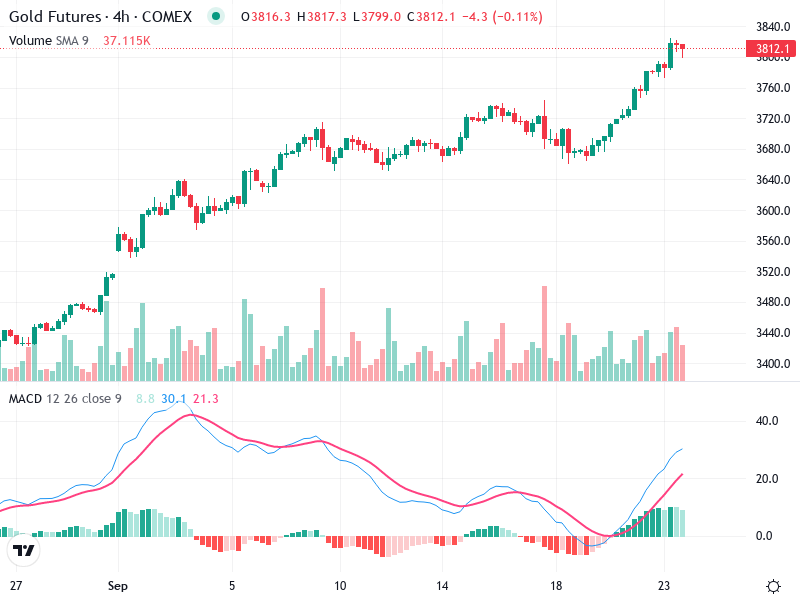
GOLD – Technical Analysis – 4h
The analysis focuses on the current chart of , highlighting potential market movements. The asset shows
The analysis focuses on the current chart of , highlighting potential market movements. The asset shows
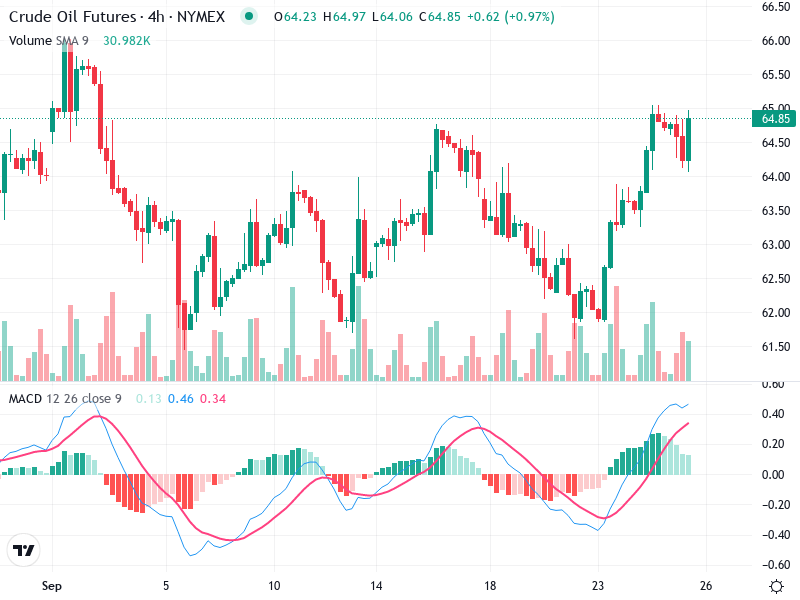
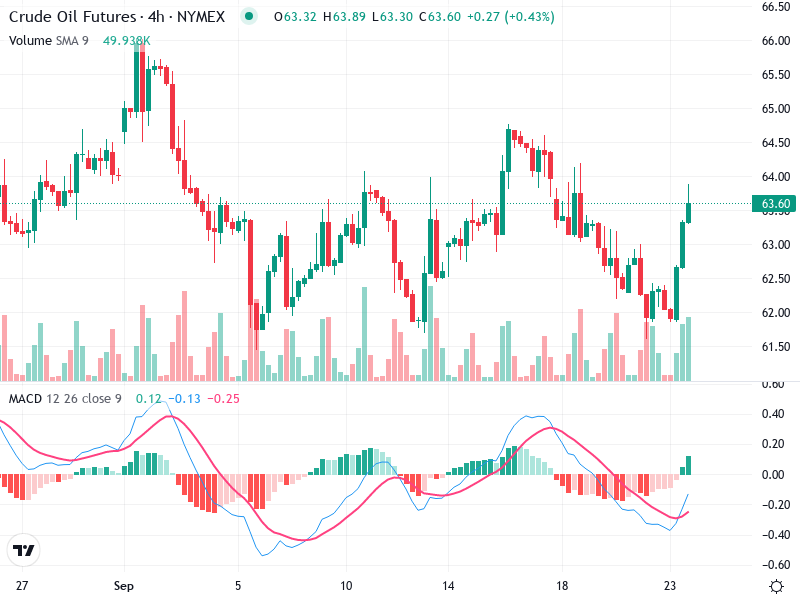
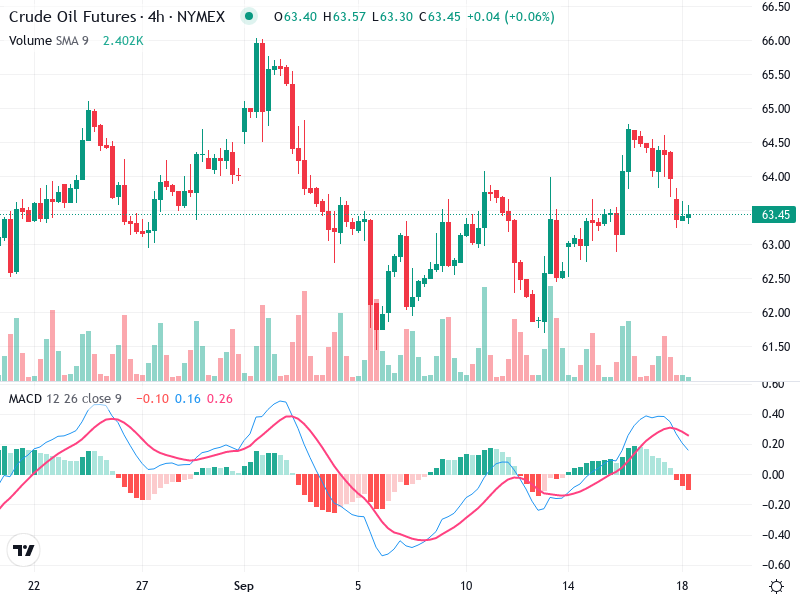
The Crude Oil Futures chart shows a bullish pattern with potential for growth. Key levels are
The Gold Futures chart showcases a recent upward trend with a noticeable pullback. Current price movements
The Crude Oil Futures chart shows bullish trends supported by significant technical indicators. Recent price movement
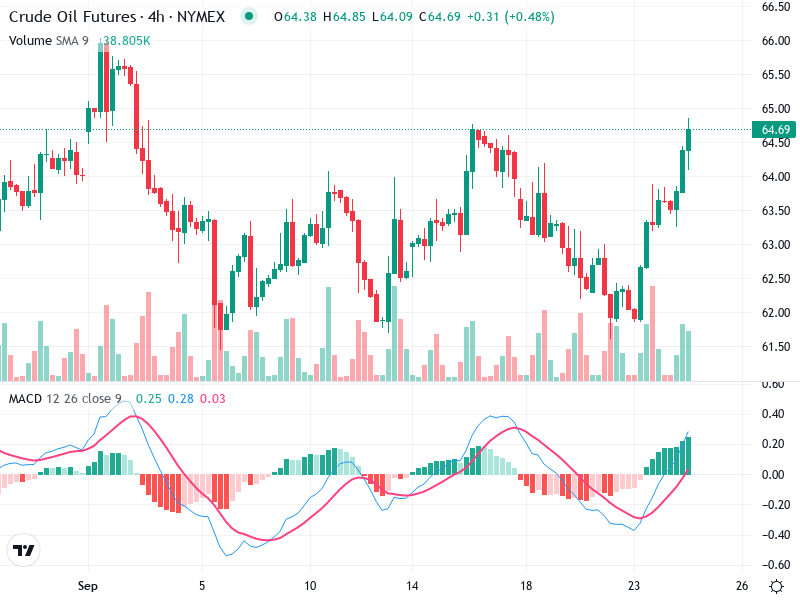
The chart for indicates a strong bullish trend. Consistent upward movement shows potential for further gains.
The chart presents a comprehensive view of the current technical setup, incorporating various indicators and trends.
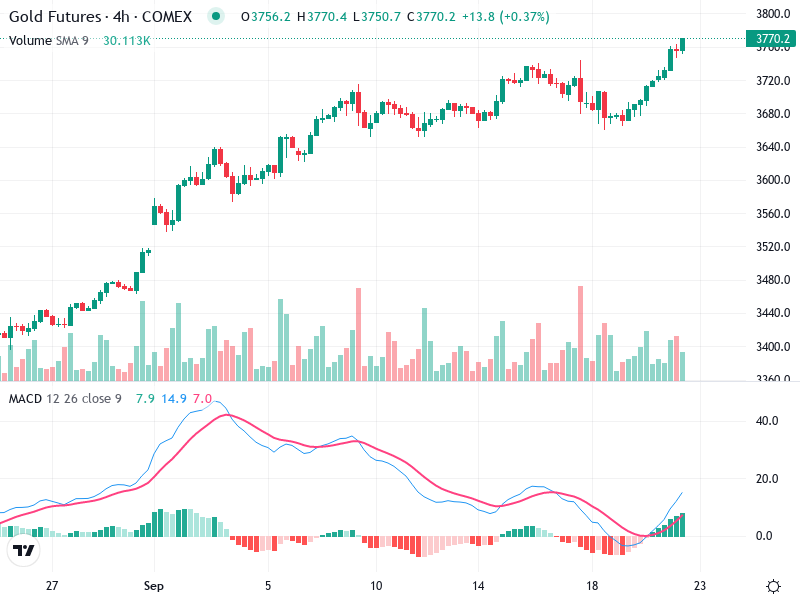
The asset is demonstrating strong upward momentum in its recent chart patterns. Technical indicators suggest further
The chart provides insight into the asset’s recent price movements and potential future trends. With varying
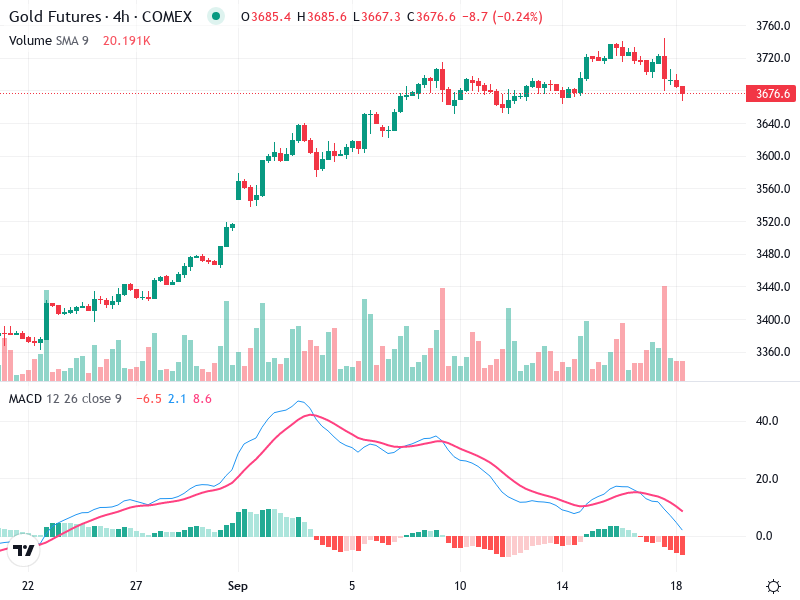
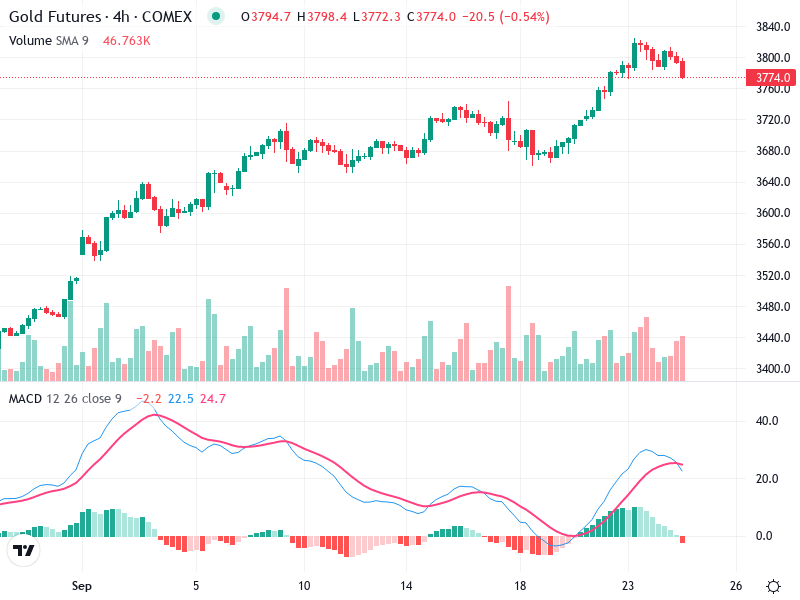
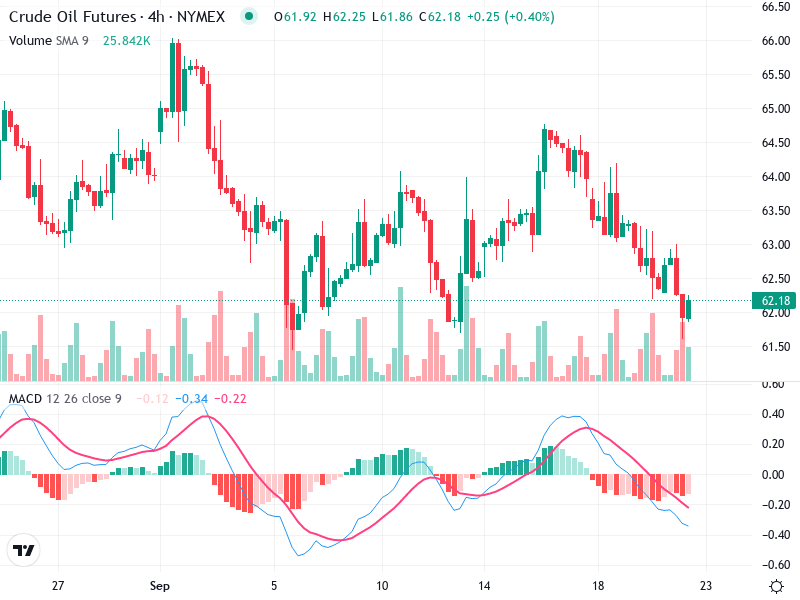
The Gold Futures chart depicts a shift in the market sentiment with recent bearish signals. Price

This asset currently showcases a sideways trend. Volatility is evident, as depicted by both candlesticks and
