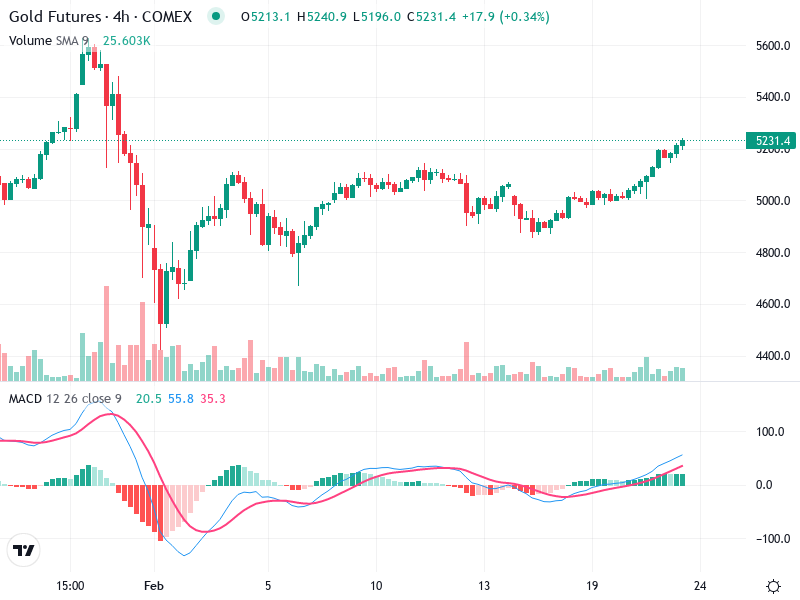
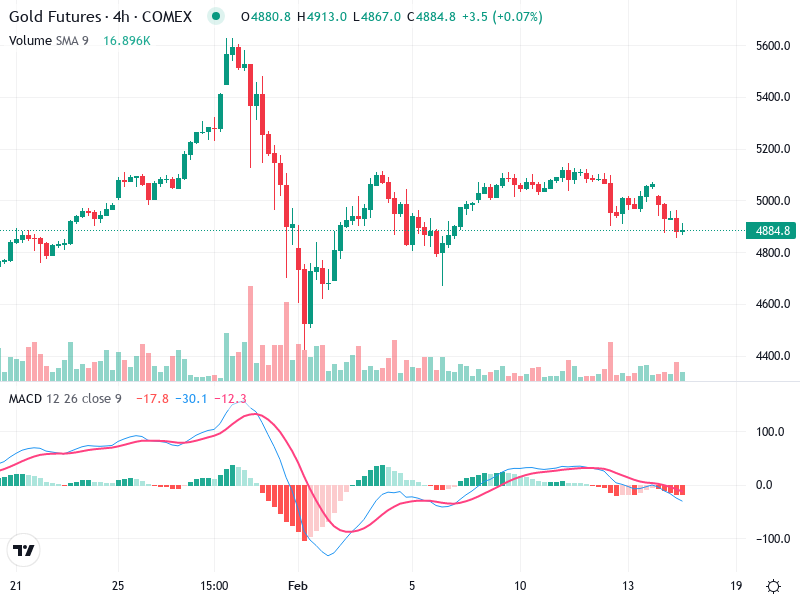
GOLD – Technical Analysis – 4h
The Gold Futures chart showcases a persistent upward trend with steady price increases. It reflects a
The Gold Futures chart showcases a persistent upward trend with steady price increases. It reflects a
The asset is exhibiting a clear upward trend in recent sessions, as demonstrated by the price
The Gold Futures chart is showing a potential buildup phase. Traders should watch for breakout signals
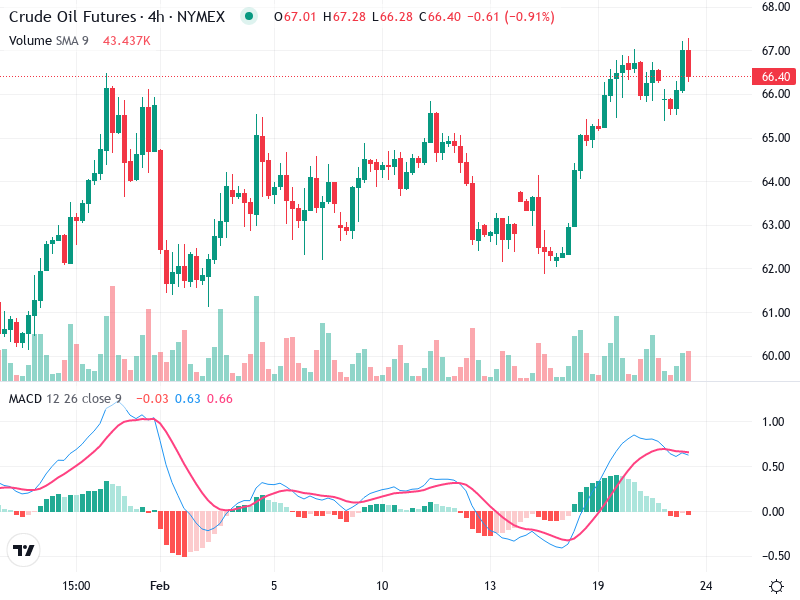
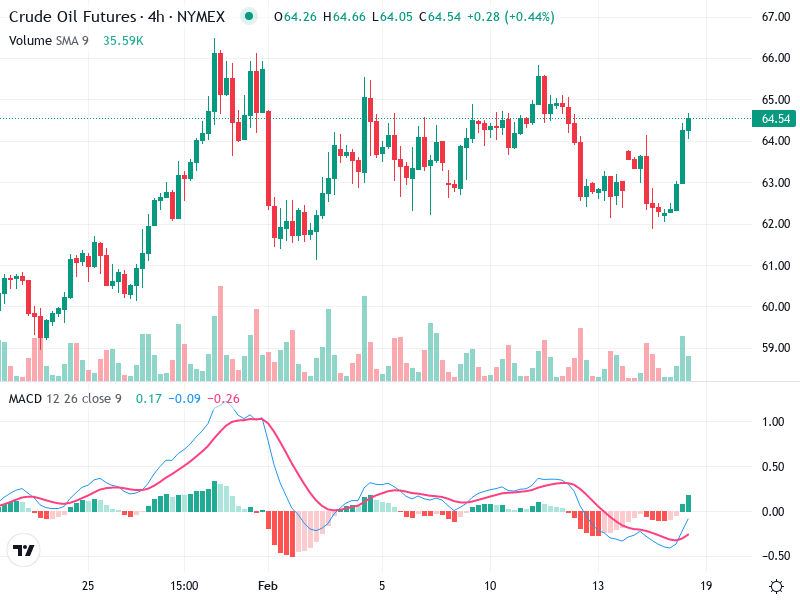
The Crude Oil Futures chart is currently exhibiting significant movements and trends. Recent changes indicate potential
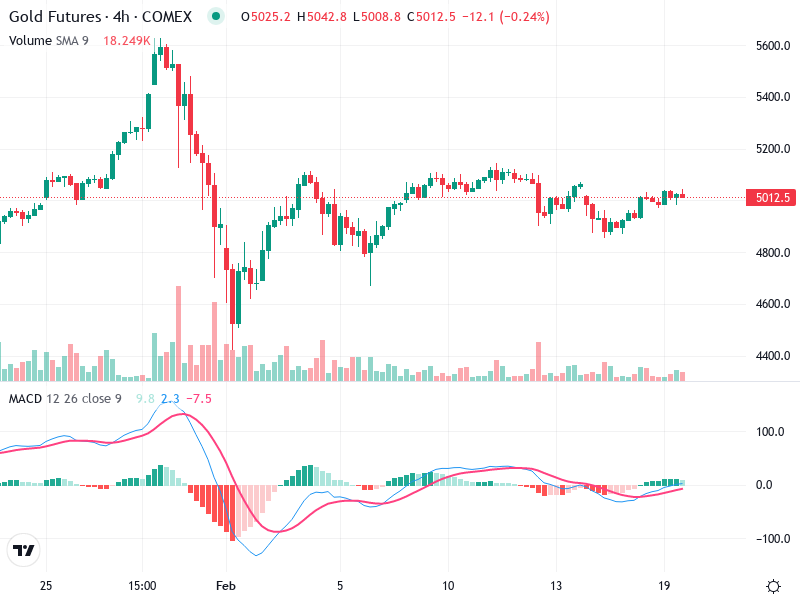
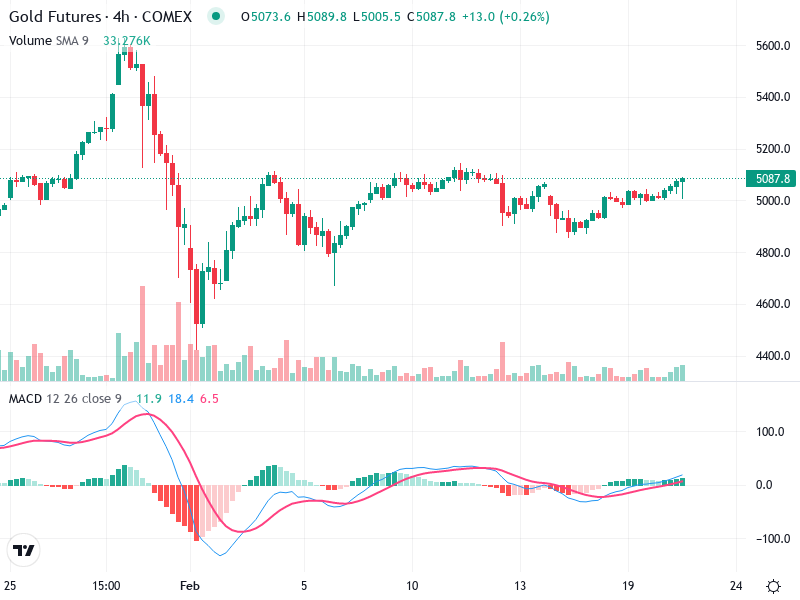
The Gold Futures chart displays periods of indecision with Doji-like candles, indicating potential reversals or consolidation.
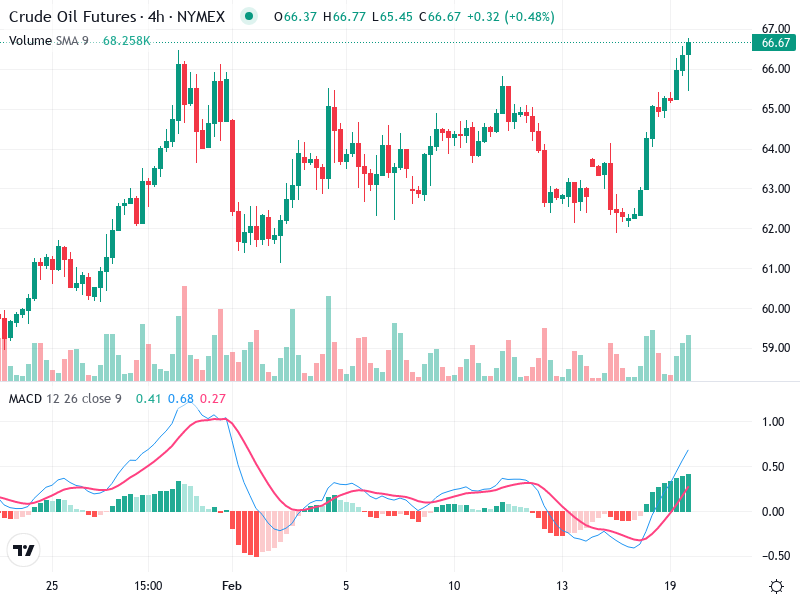
The Crude Oil Futures chart exhibits a prominent bullish trend, indicating a possibility of further price
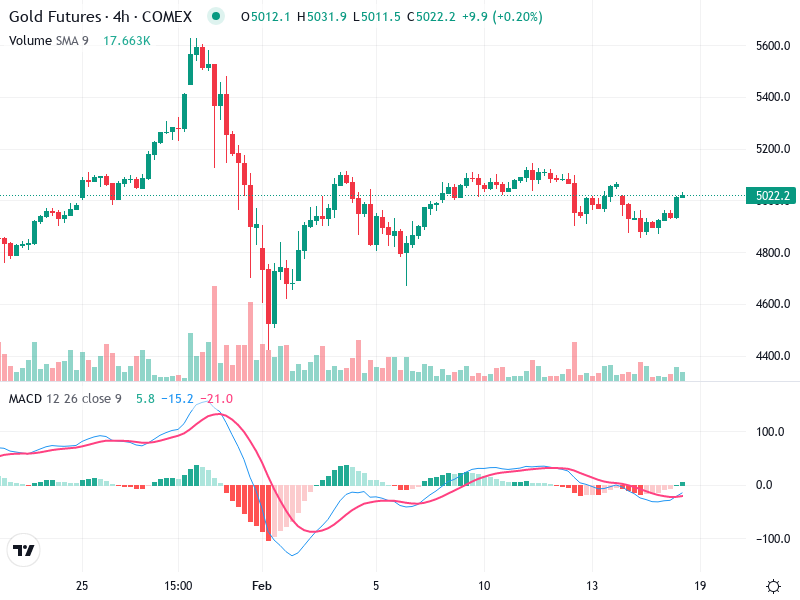
The gold futures chart shows mixed signals with periodic bullish rallies followed by bearish corrections, creating
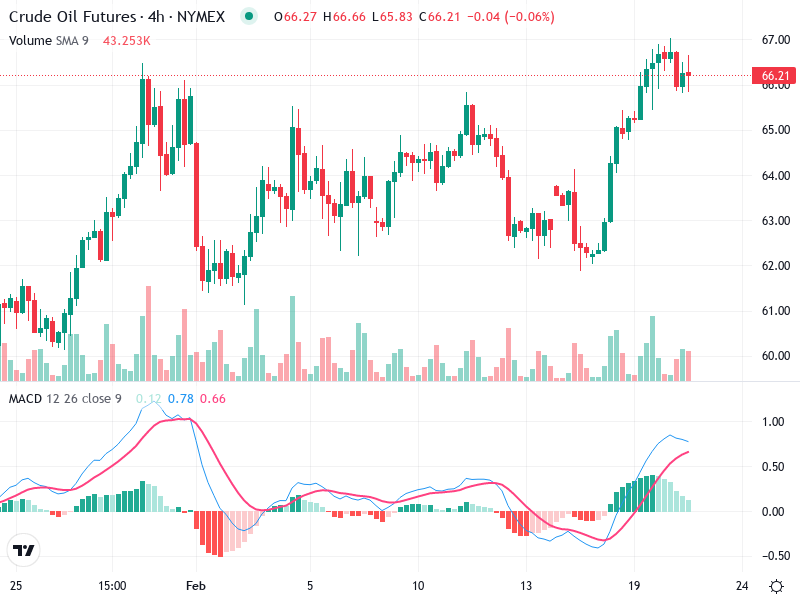
The recent analysis of the chart for indicates noteworthy movements. The asset has shown significant changes
The chart depicts significant market activities with essential levels of support and resistance. has seen a
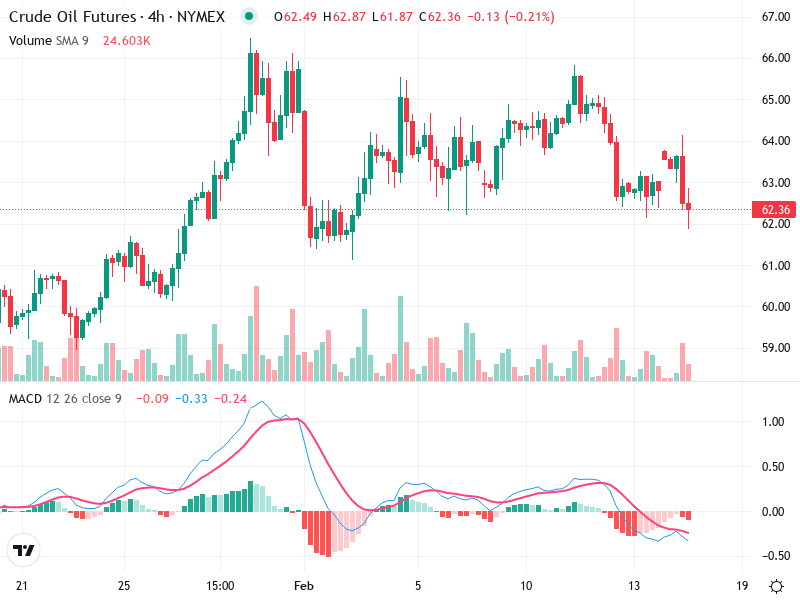
The Crude Oil Futures chart displays a market in a transitional phase, balancing between a potential
