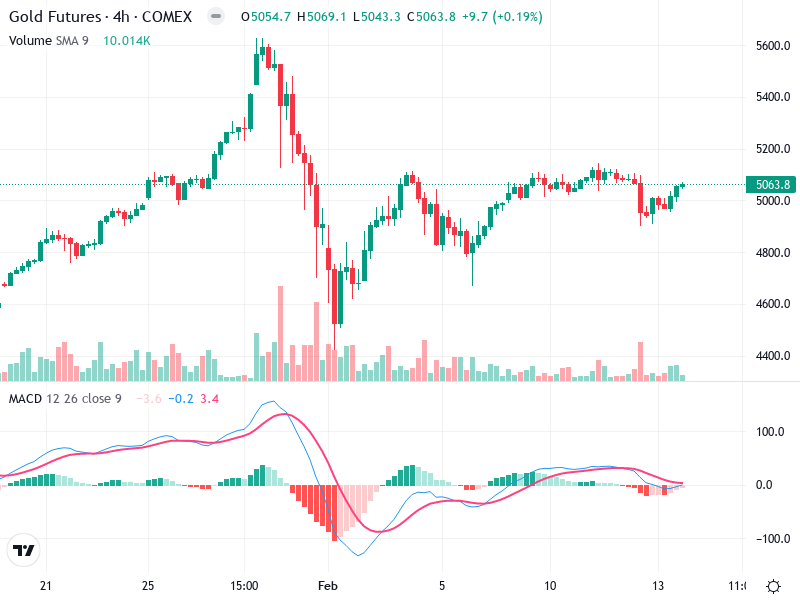
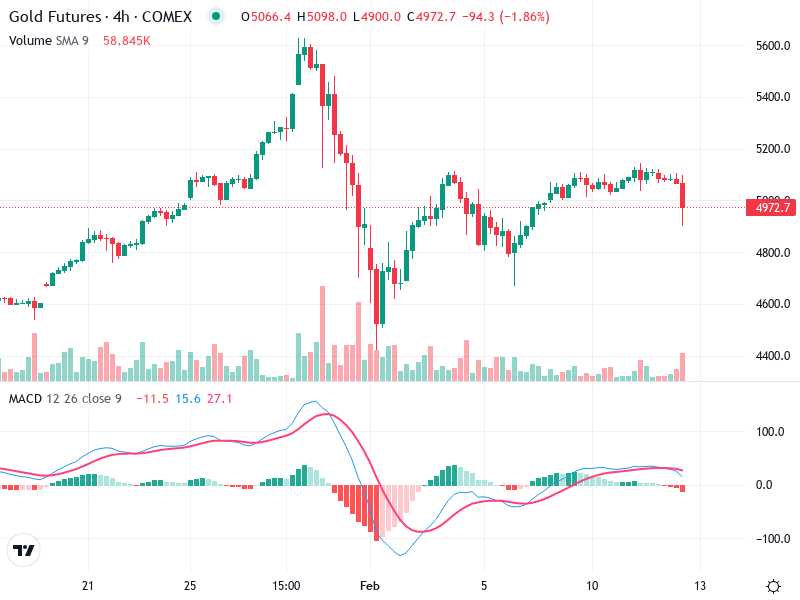
GOLD – Technical Analysis – 4h
The analysis focuses on the asset’s price movement and key levels. The asset is currently experiencing

February 16, 2026
The analysis focuses on the asset’s price movement and key levels. The asset is currently experiencing
This chart provides a comprehensive analysis of the asset’s current technical state. The recent price movements
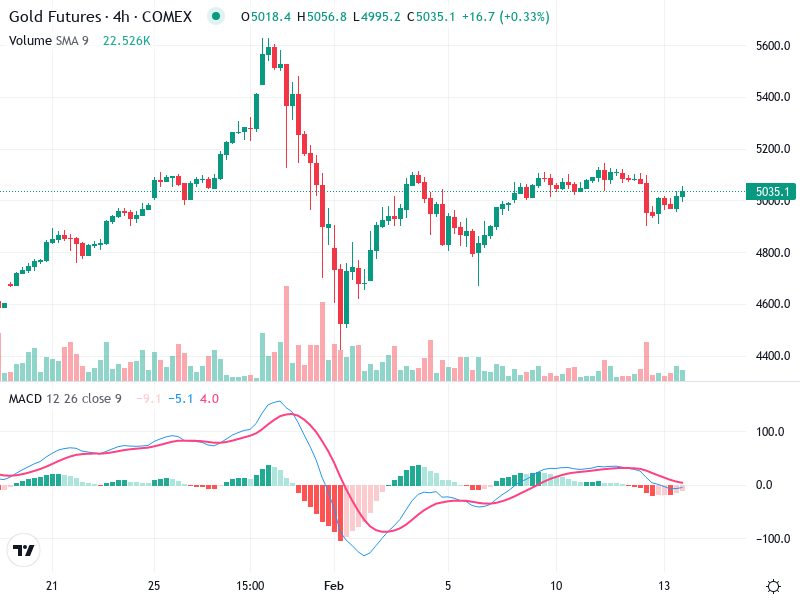
The asset is currently exhibiting mixed signals on the charts. After a period of decline, the
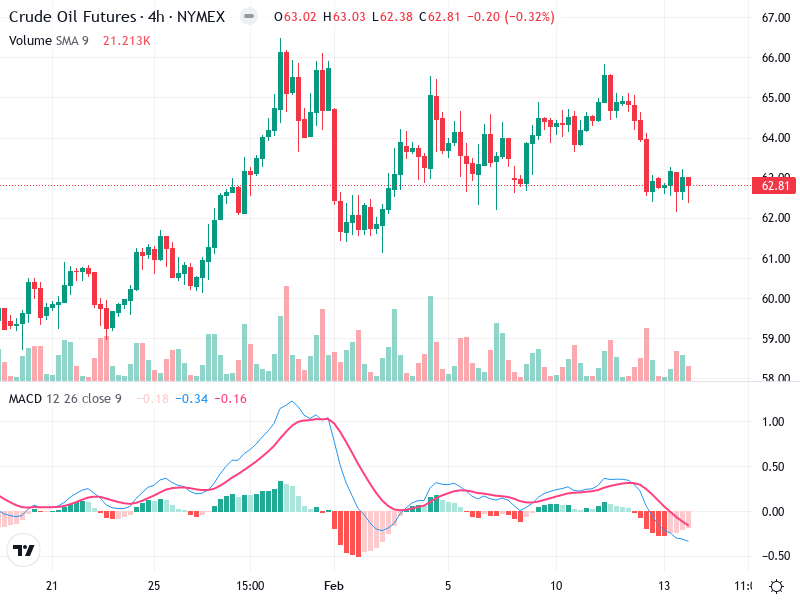
The Crude Oil Futures 4-hour chart indicates a prevailing sideways trend with recent bearish pressure. The
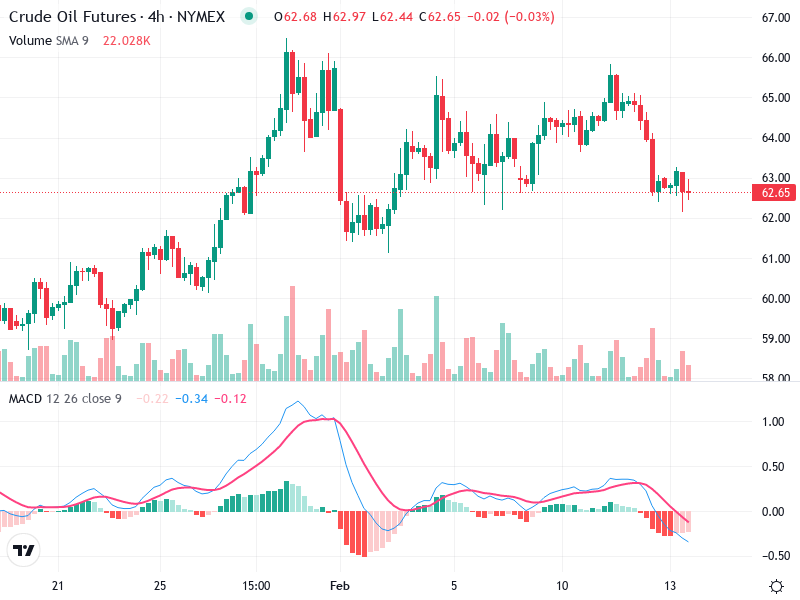
The current chart analysis of shows a shift in market movement. Key indicators such as candlestick
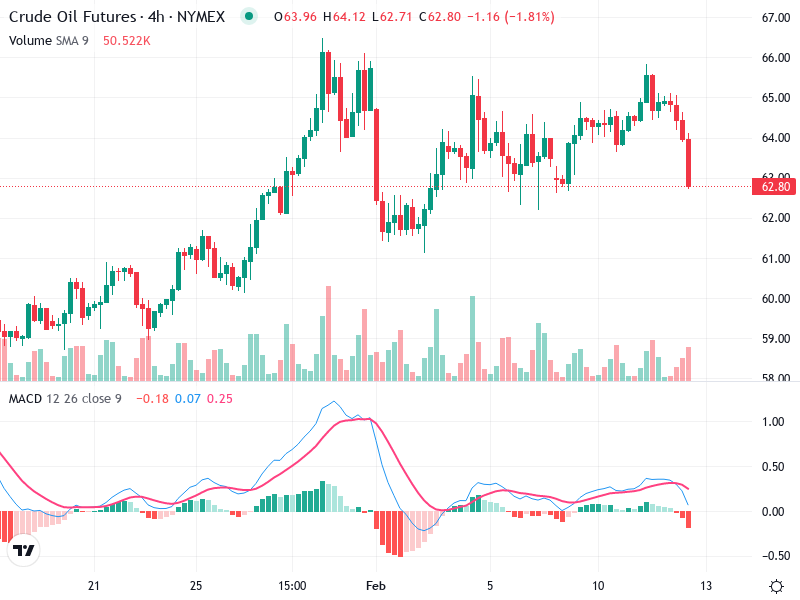
The chart indicates a noticeable shift in trend dynamics. Recent bearish patterns suggest a possible continuation
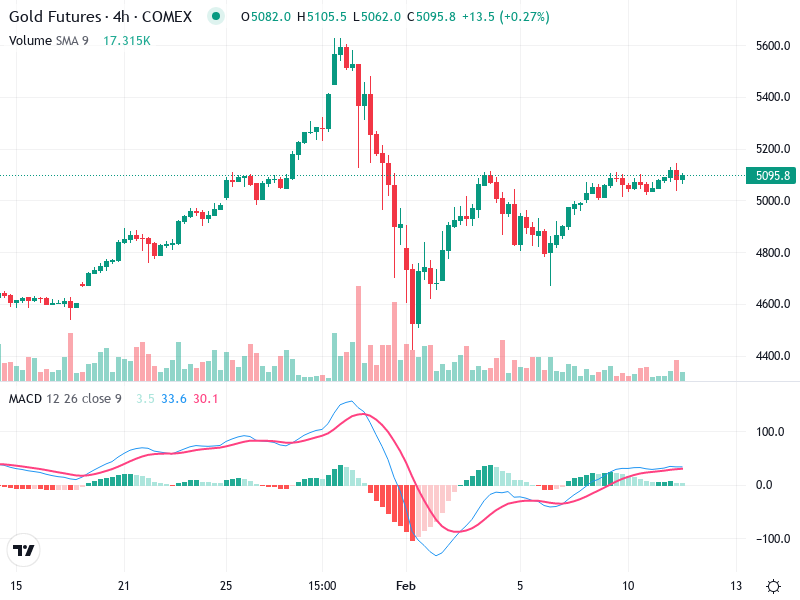
The Gold futures chart on the 4-hour timeframe indicates a recovery phase after a significant drop.
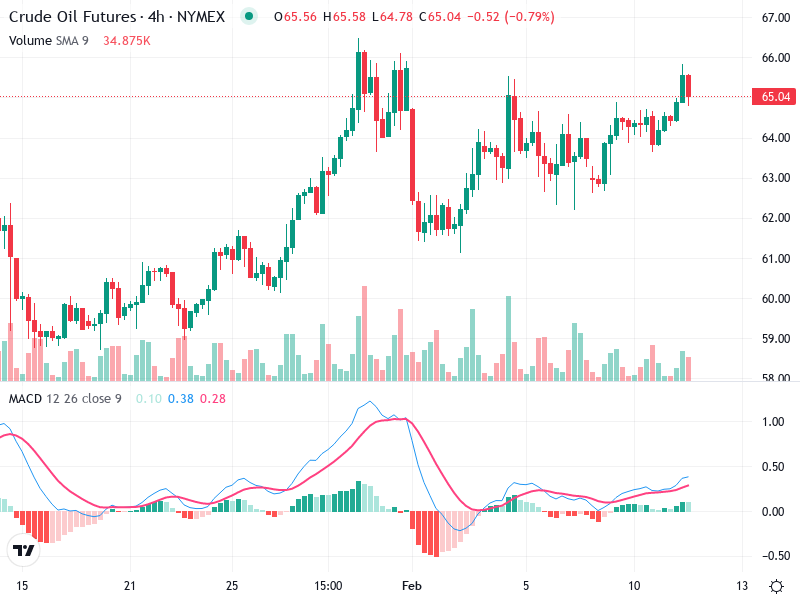
The chart for Crude Oil Futures shows recent upward momentum after a period of consolidation. There
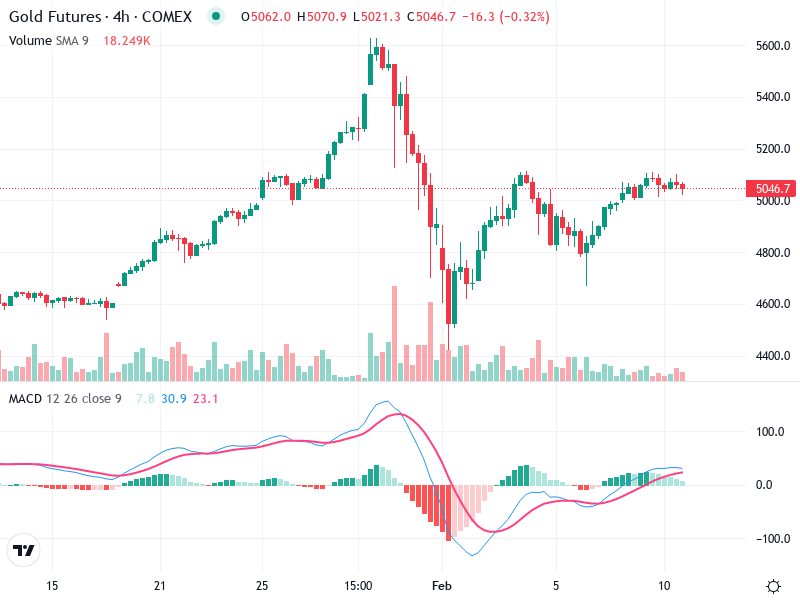
Gold Futures on a 4-hour chart indicates a recent shift in trend. The asset experienced a
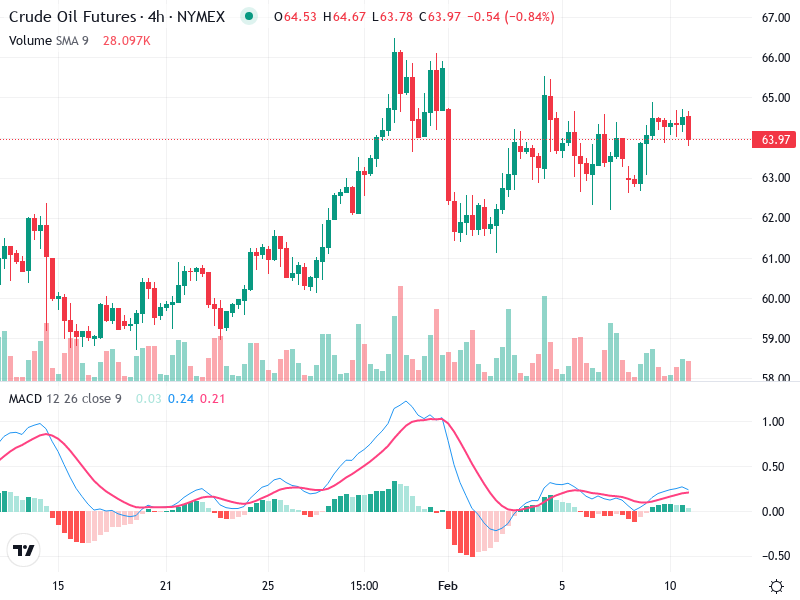
In this analysis, we examine the recent movements of Crude Oil Futures on a 4-hour NYMEX
