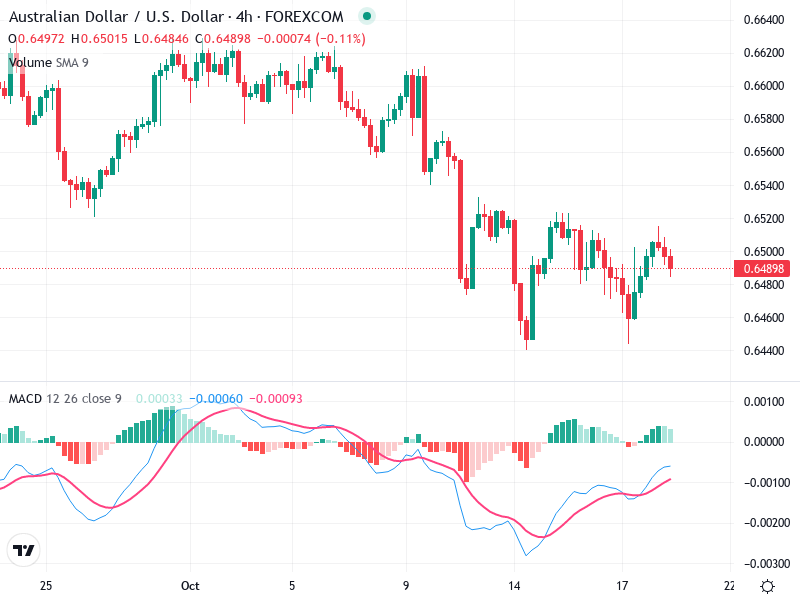
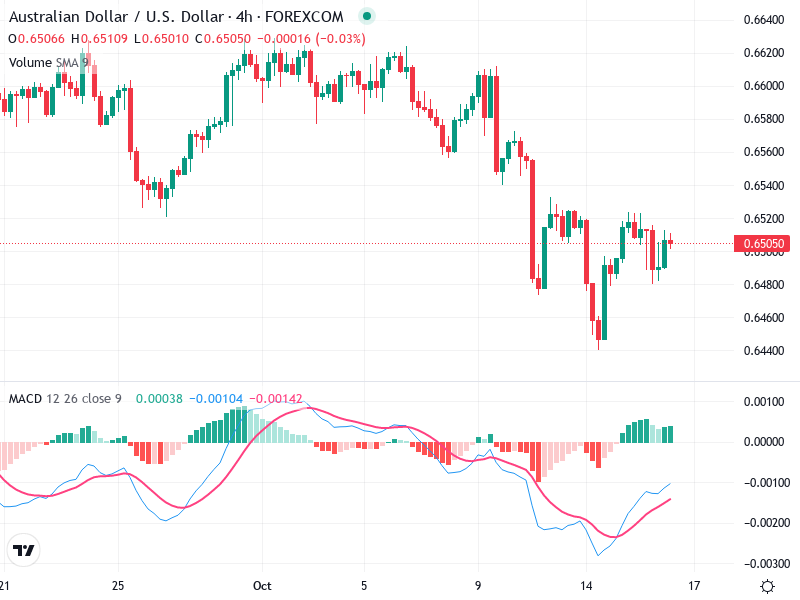
AUD/USD – Technical Analysis – 4h
The AUD/USD chart displays a potential change in trend direction. The asset has recently shown signs
The AUD/USD chart displays a potential change in trend direction. The asset has recently shown signs
The chart depicts a period of consolidation after a bearish trend for the asset. The candlestick
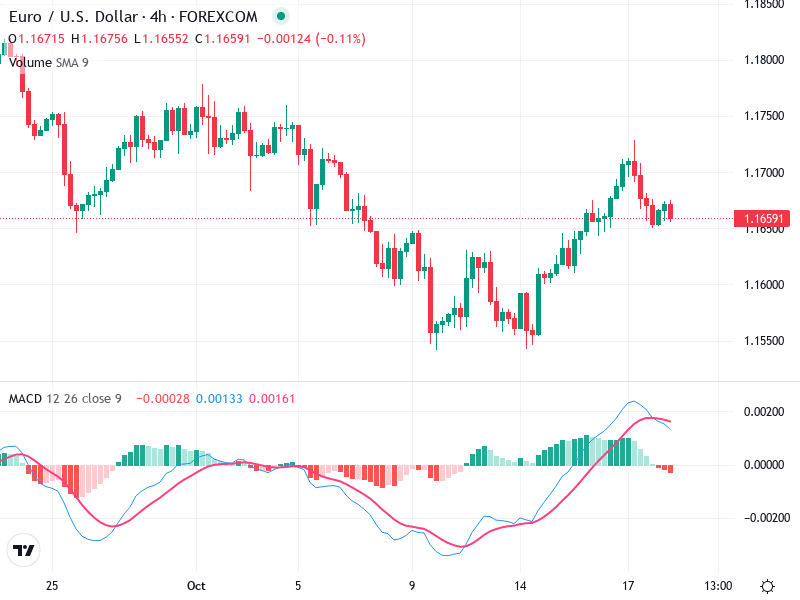
The EUR/USD 4-hour chart presents a detailed analysis utilizing various technical indicators. The analysis highlights key
The chart exhibits significant bullish signals, particularly in recent patterns. The asset has shown a propensity


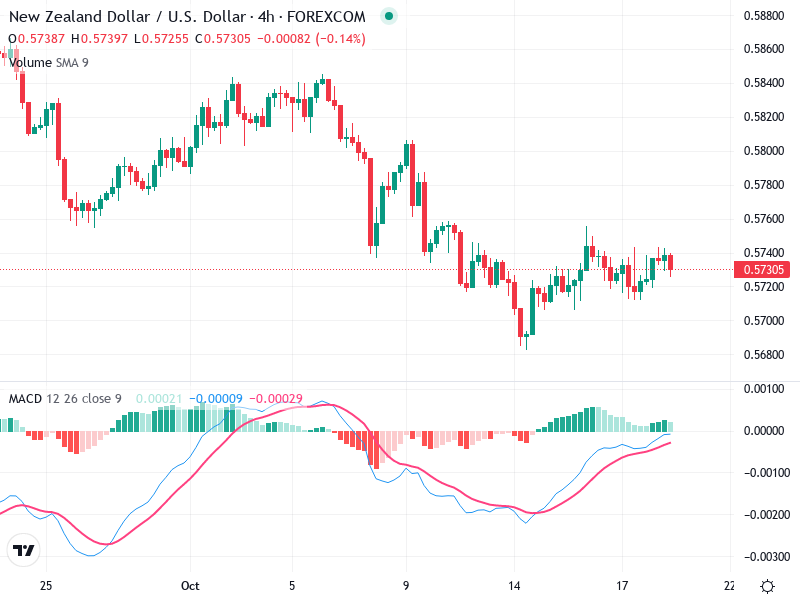
The recent analysis of the chart showcases a potential trend reversal following a downtrend. The patterns

The chart highlights a recent consolidation phase around the 0.57200 level during a generally bearish trend.
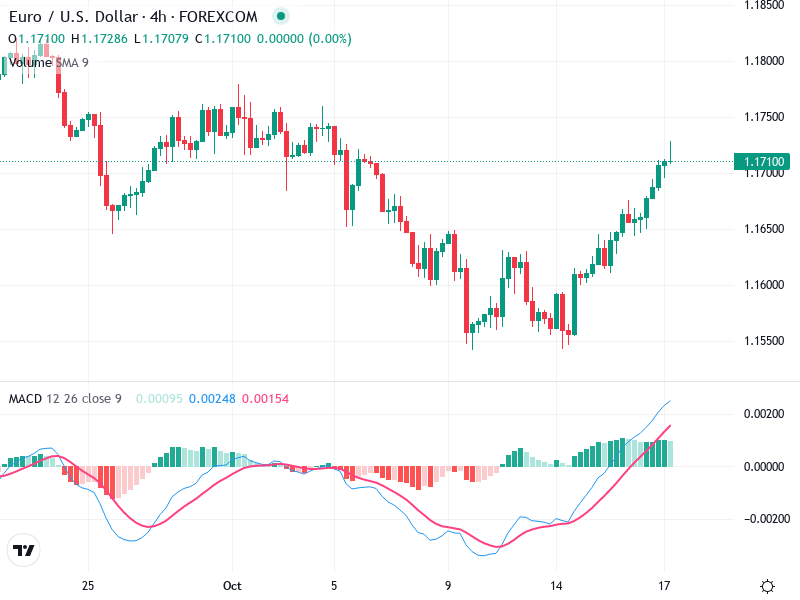
The EUR/USD chart shows a significant bullish trend with recent upward momentum. The asset has reversed
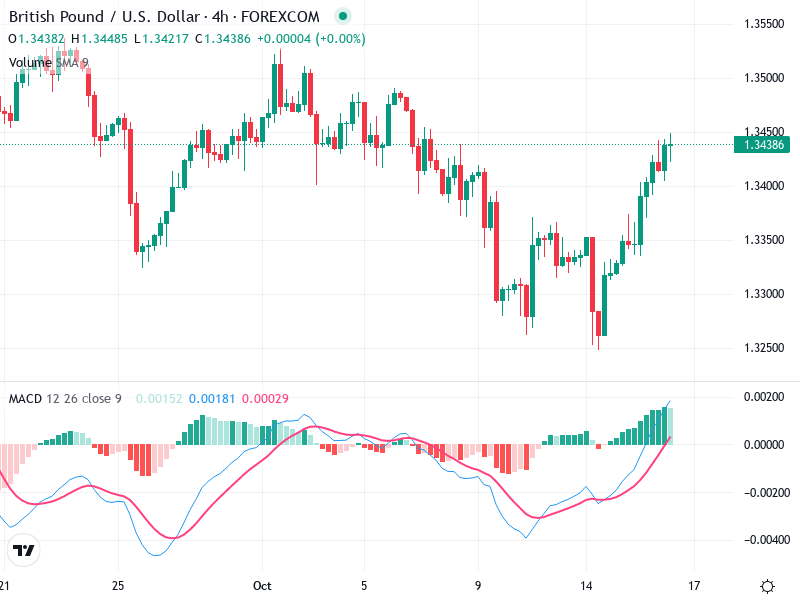
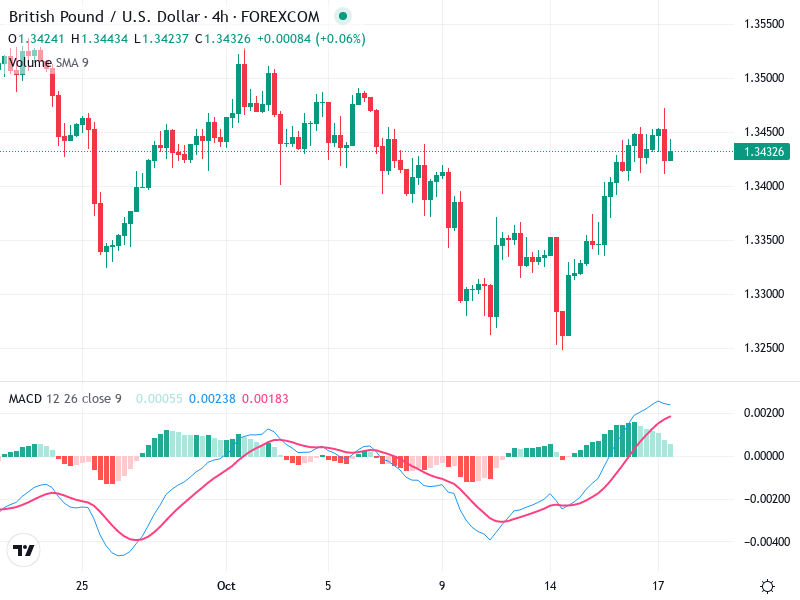
The GBP/USD chart exhibits a notable upward trend on the 4-hour timeframe. Recent market actions suggest
The chart indicates a potential shift in trend for the asset. Recent patterns suggest a possible
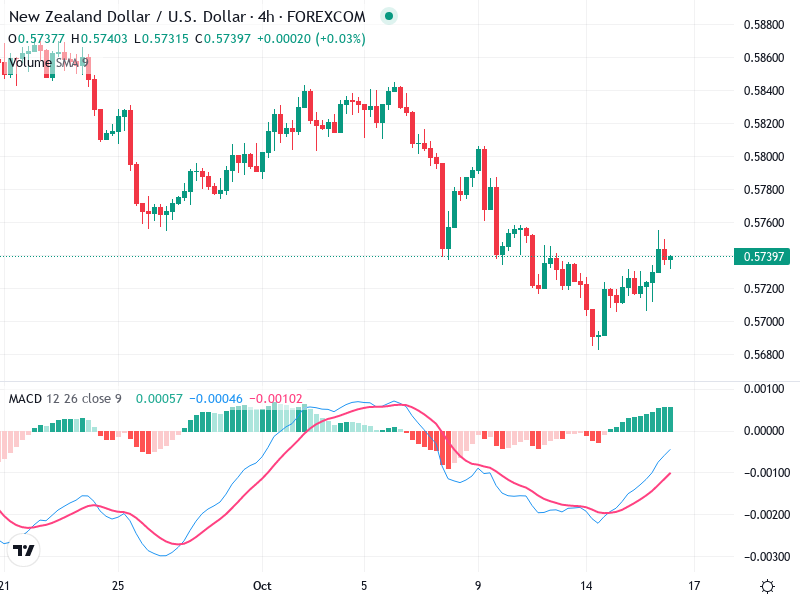
The NZD/USD chart shows recent market indecision with potential bullish movement emerging. The asset’s overall trend
