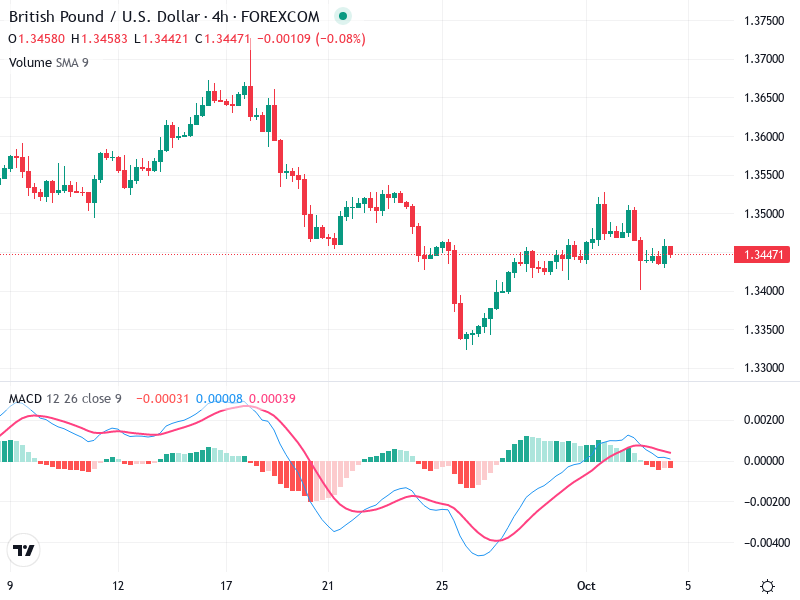
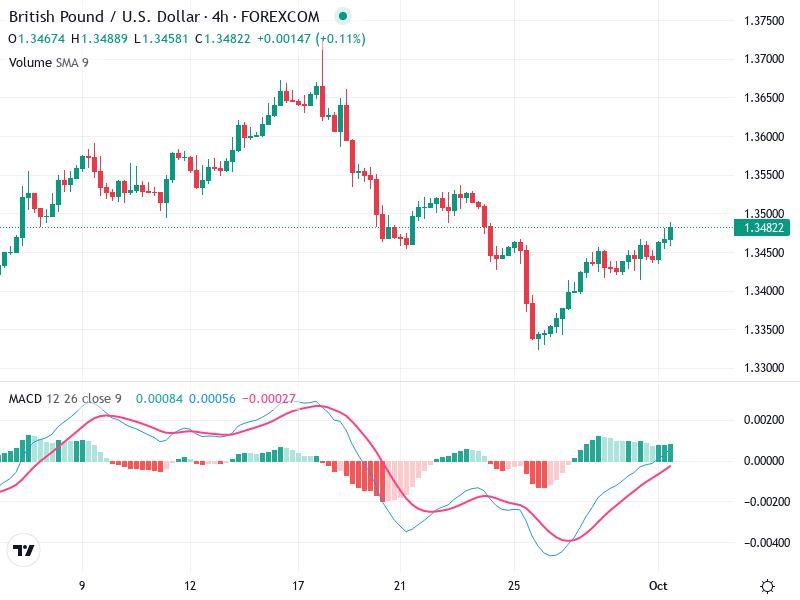
GBP/USD – Technical Analysis – 4h
The GBP/USD chart highlights a recent shift from a strong downtrend to a sideways consolidation phase,

October 3, 2025
The GBP/USD chart highlights a recent shift from a strong downtrend to a sideways consolidation phase,
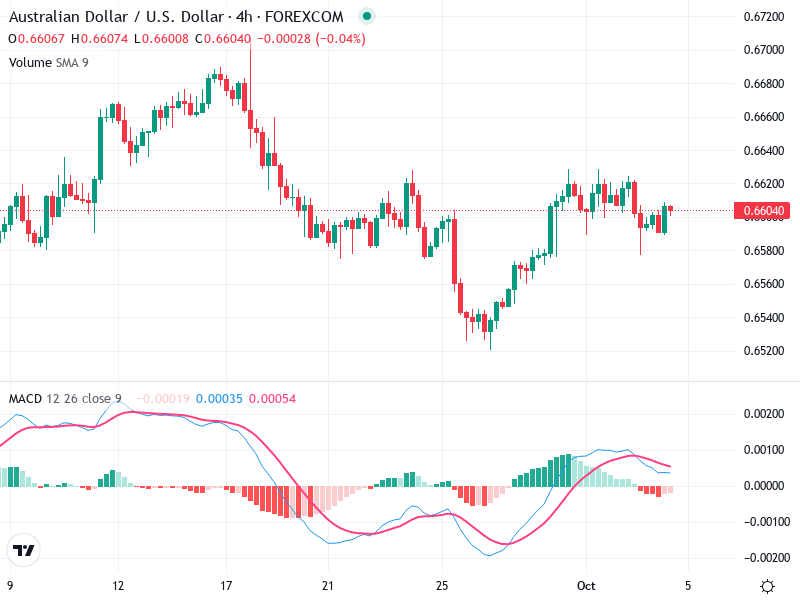
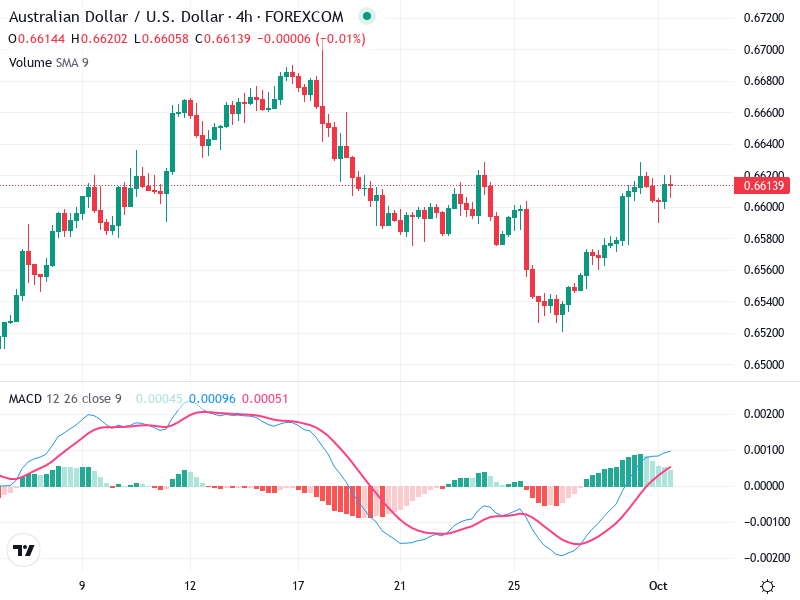
The AUD/USD chart illustrates a consolidation phase with prices oscillating between key levels. Significant candlestick patterns
The chart presents a series of bullish candlesticks, indicating a potential recovery from recent lows for
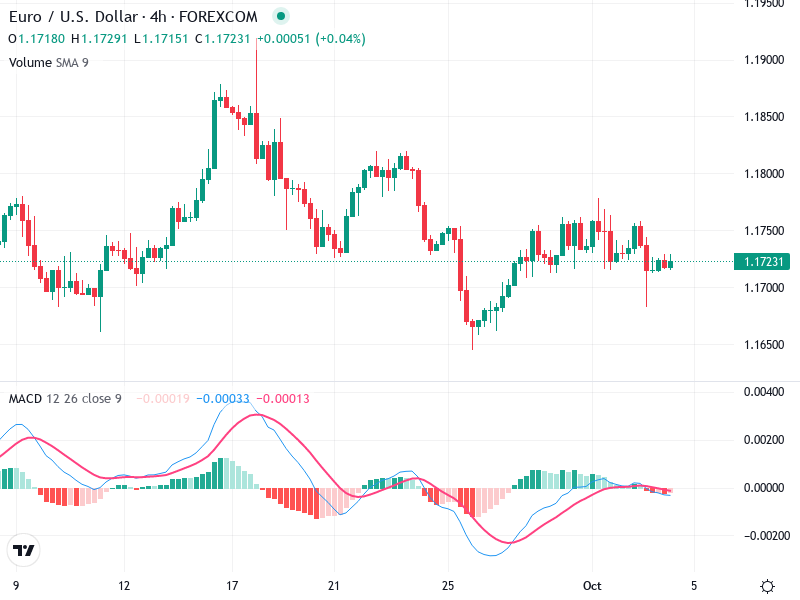
The EUR/USD chart portrays a period of market indecision with a sideways trend following a previous
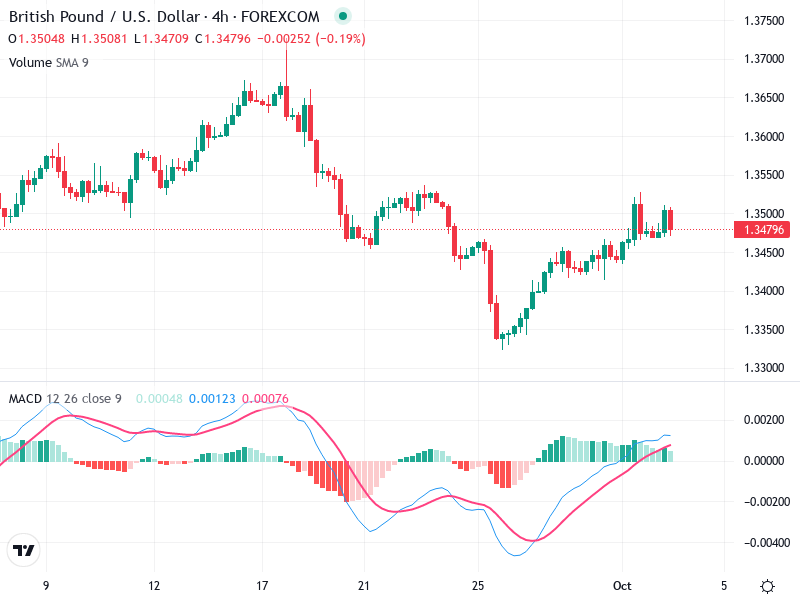
The GBP/USD 4-hour chart shows a transition from a downtrend to a more neutral or slightly
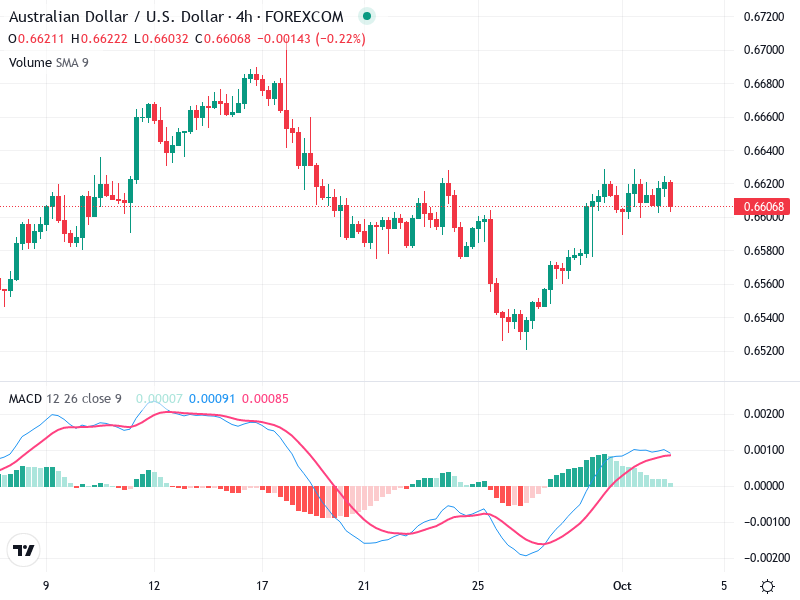
The Australian Dollar / U.S. Dollar chart exhibits intriguing movements over the 4-hour timeframe. A trend
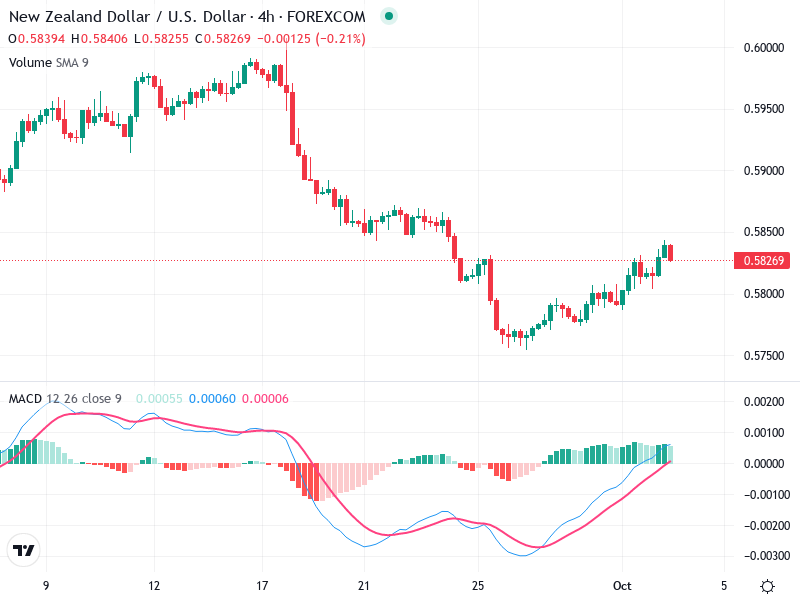
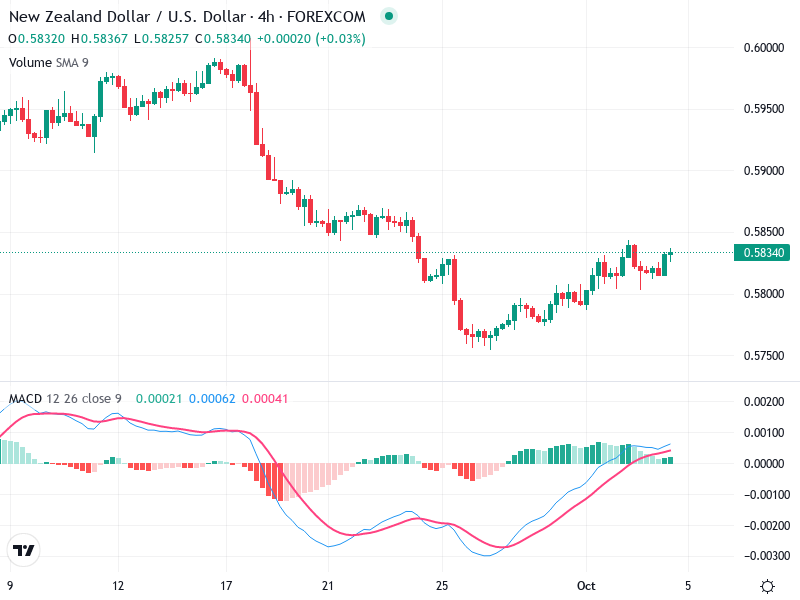
The chart for the asset shows a recent technical change with an indication of a potential
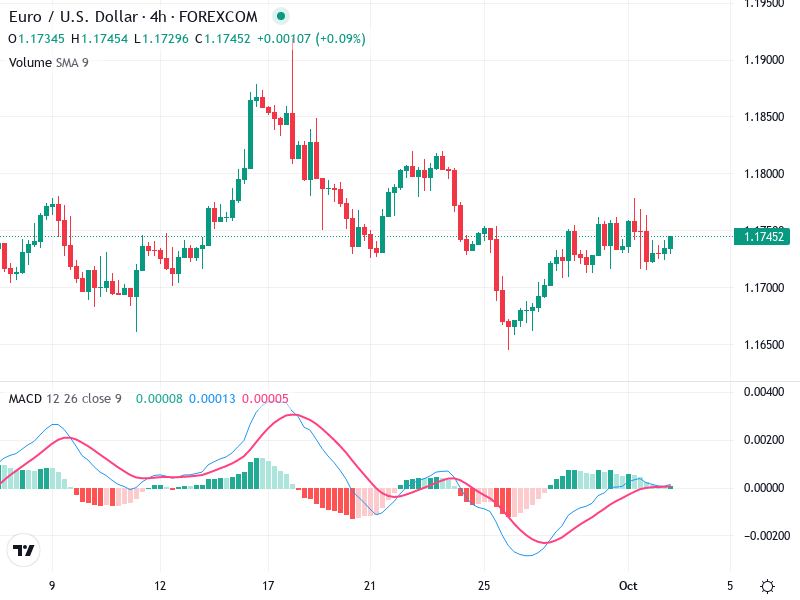
The EUR/USD chart displays a pattern of gradual recovery following a noticeable downturn. The asset shows
The chart of suggests a potential shift in trend direction. Strong technical indicators are pointing to
The chart for indicates a potential change in market direction. Key technical indicators suggest strengthening bullish
