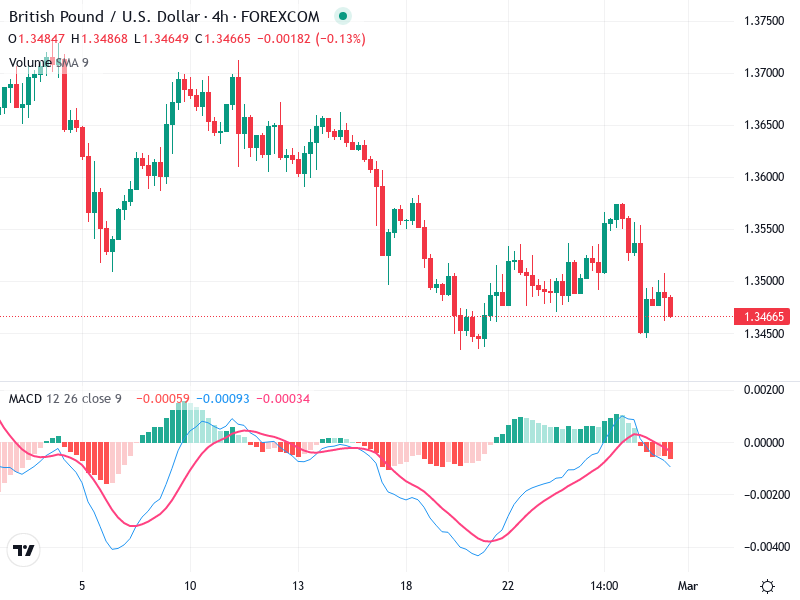
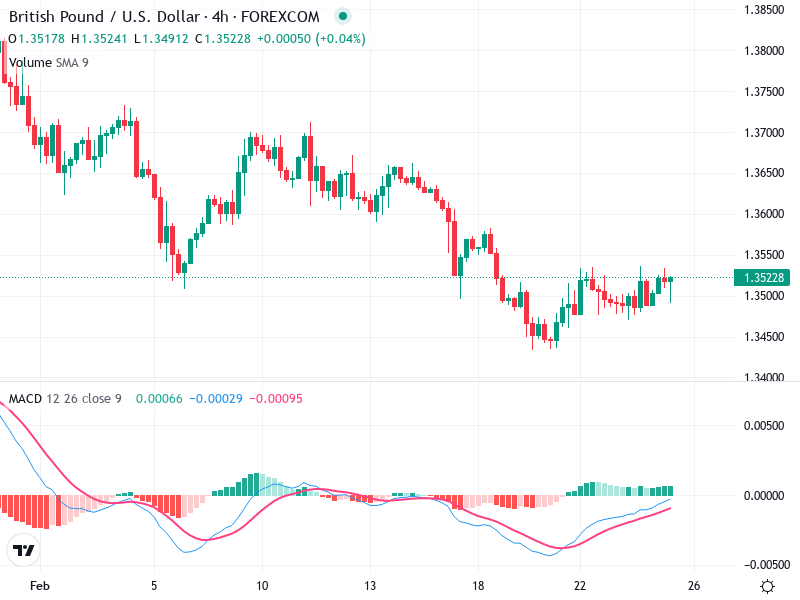
GBP/USD – Technical Analysis – 4h
The GBP/USD chart reveals a bearish sentiment, driven by significant technical indicators. Recent trends and patterns
The GBP/USD chart reveals a bearish sentiment, driven by significant technical indicators. Recent trends and patterns
This technical analysis provides insights into the recent price movements and potential future trends of the
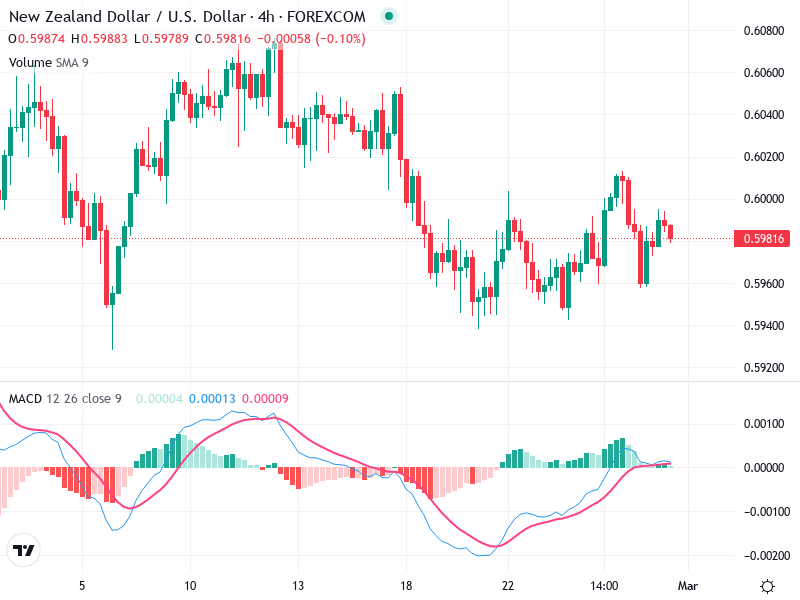
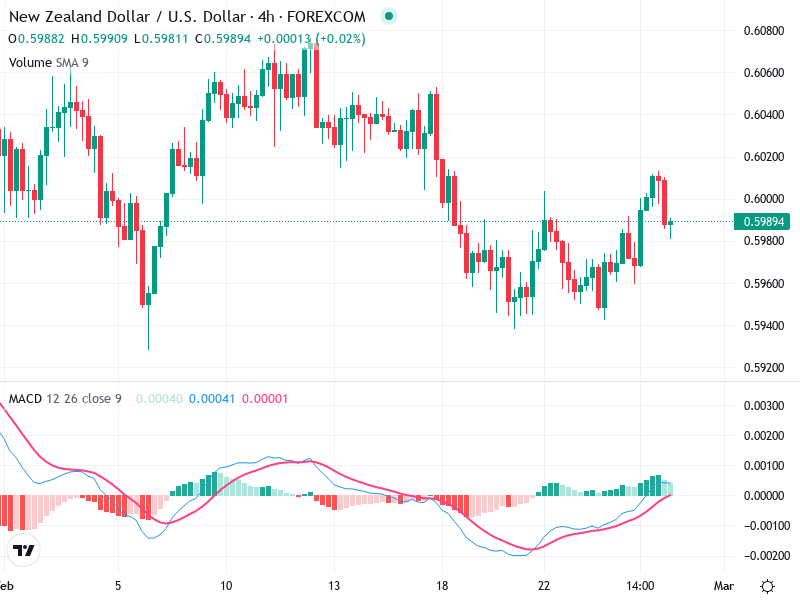
The NZD/USD 4-hour chart shows recent sideways movement after a previous bearish trend. Indecision is evident,
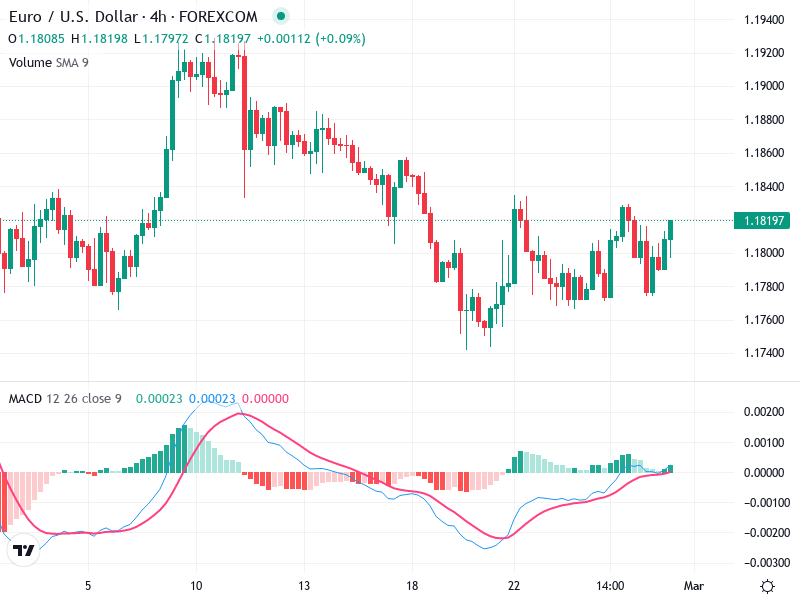
The EUR/USD 4-hour chart displays a combination of potential bullish reversal patterns such as doji and
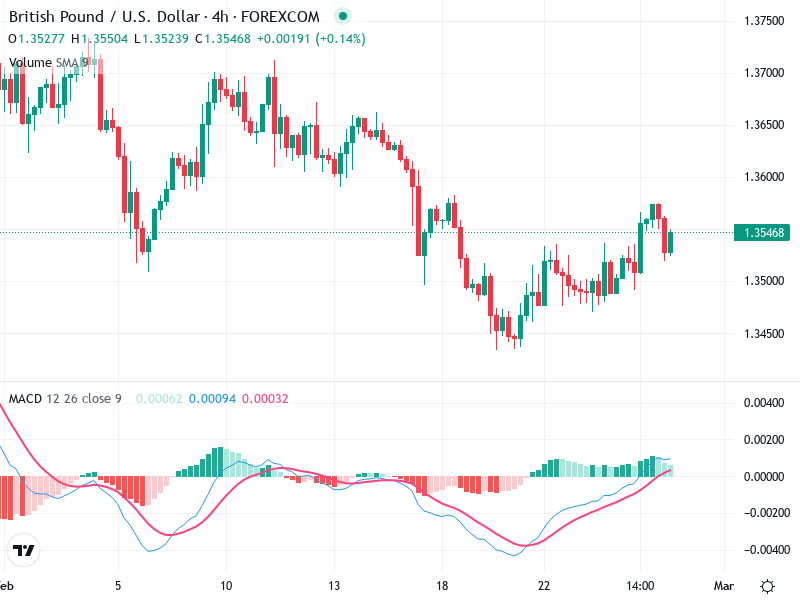
The GBP/USD 4-hour chart suggests a potential bullish reversal following recent price movement. Key indicators align
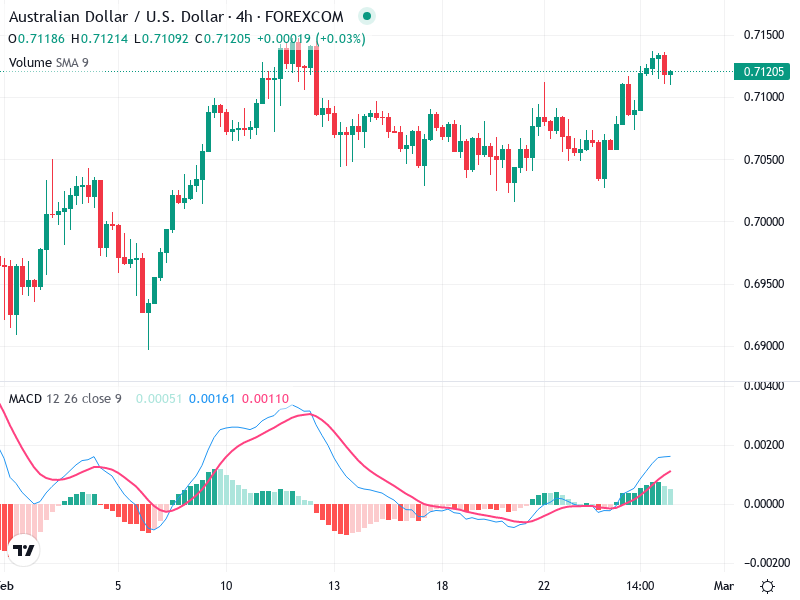
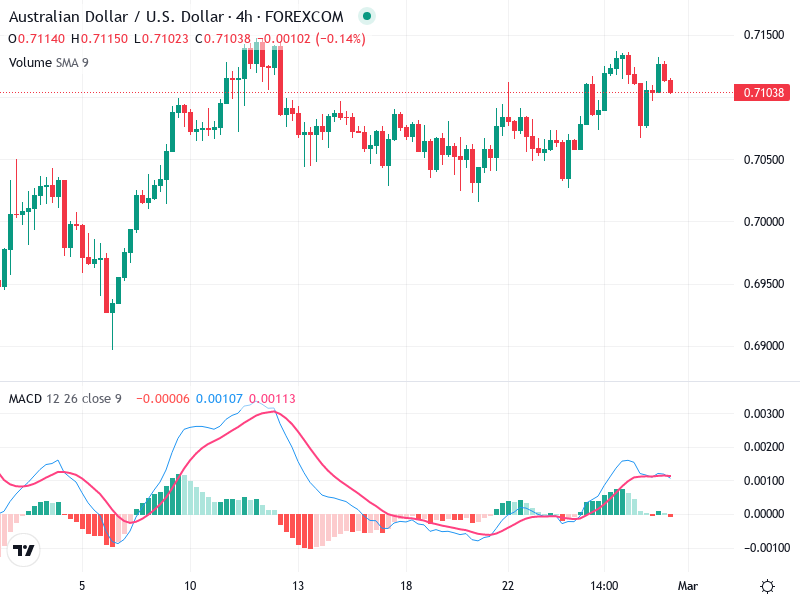
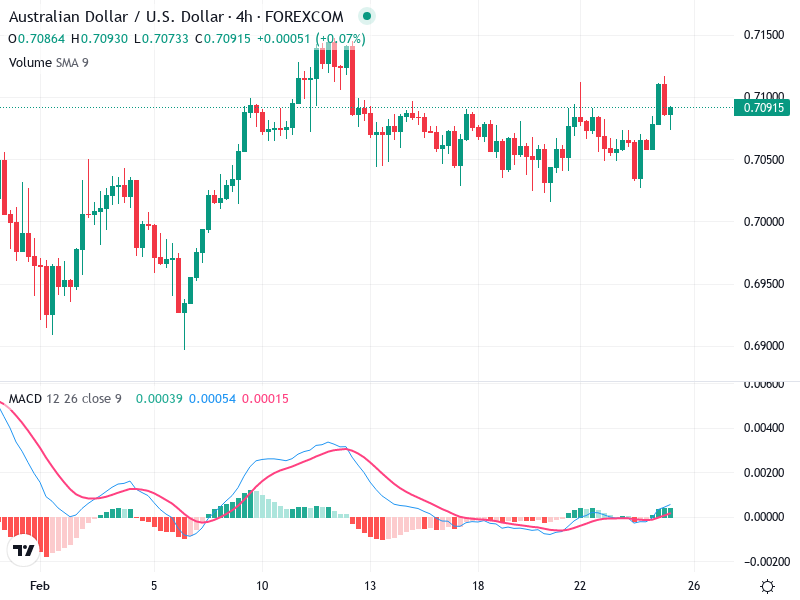
The asset is currently undergoing an upward trend characterized by consistent bullish patterns. Recent price actions
The chart for the asset shows significant activity at key support and resistance levels. The asset’s
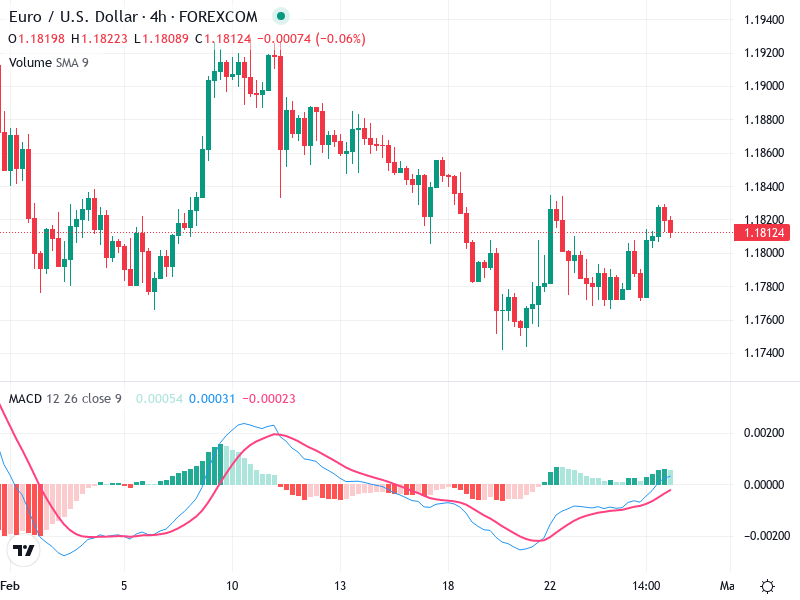
The EUR/USD 4-hour chart indicates evolving market dynamics, currently showing a potential shift from bearish to
The candlestick patterns on the asset’s chart reflect a persistent bearish trend since early February, with
The chart displays a sideways trend with bullish movements emerging from a recent dip. The asset
