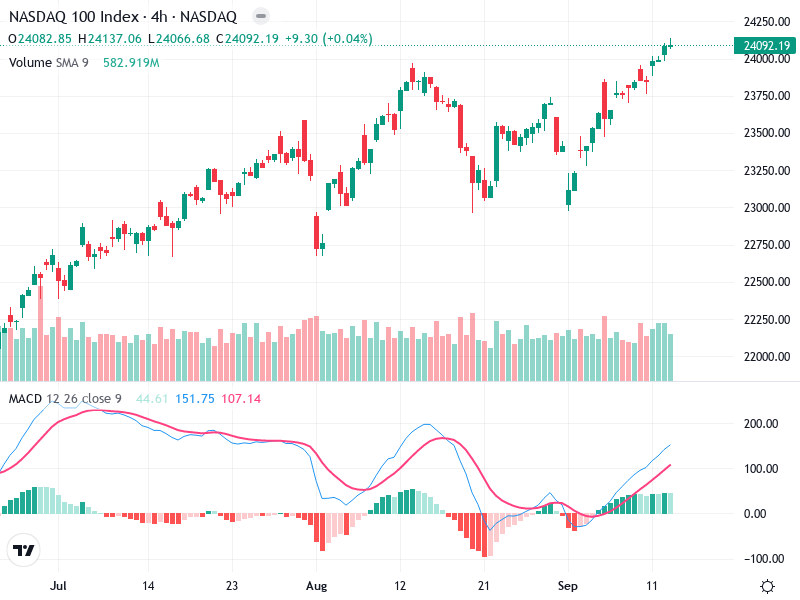
NSDQ – Technical Analysis – 4h
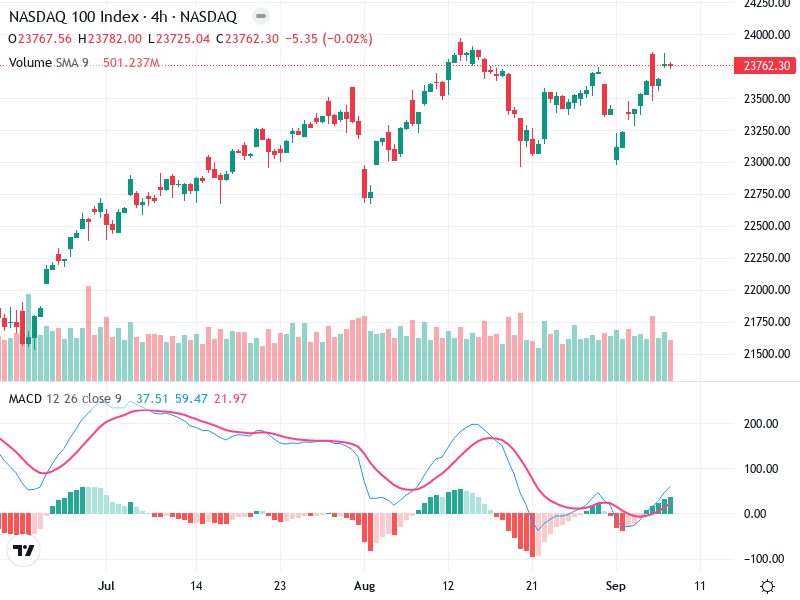
The NASDAQ 100 Index is exhibiting bullish momentum on the 4-hour chart. Recent analysis shows a
The NASDAQ 100 Index is exhibiting bullish momentum on the 4-hour chart. Recent analysis shows a
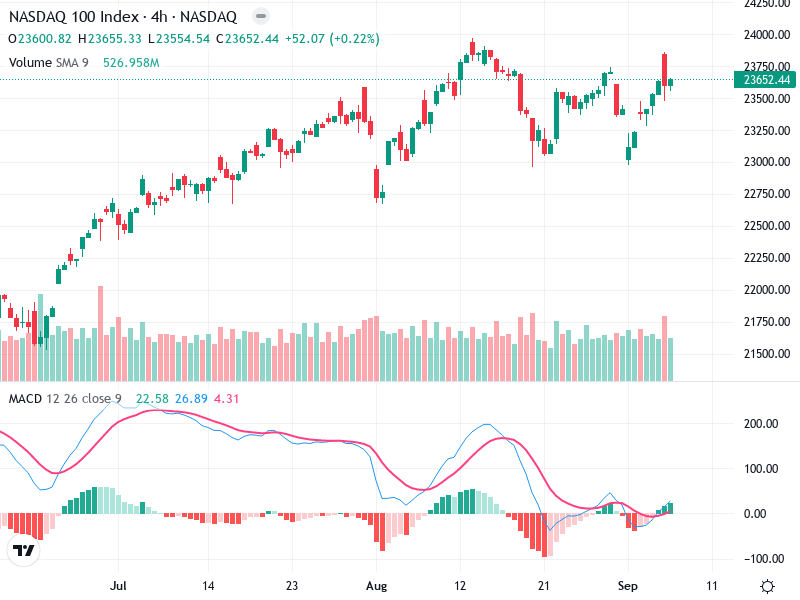
The NASDAQ 100 Index has displayed a noticeable upward movement, showcasing a bullish trend since early
The chart depicts an ongoing bullish trend with increasing highs and lows since mid-August. The asset
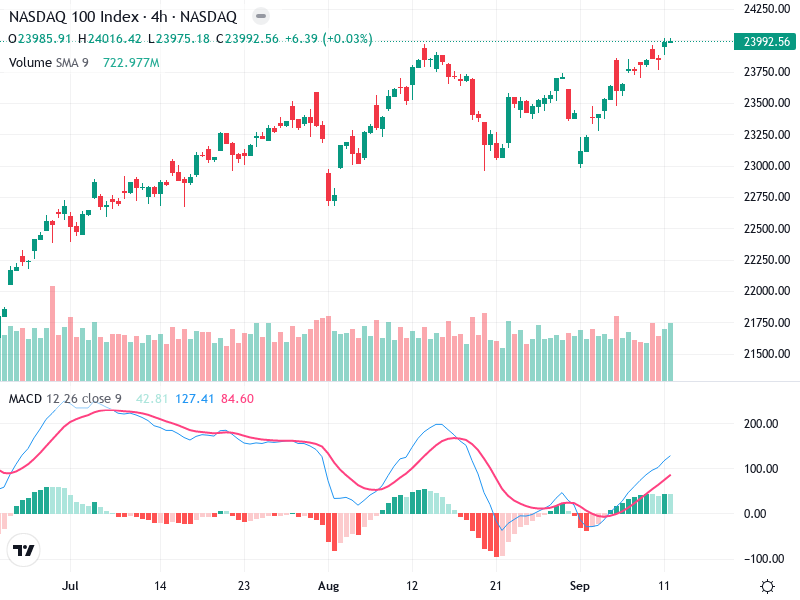
The chart of shows intriguing dynamics with distinct patterns emerging. The asset displays a consistent trend,
This analysis provides insights into the recent performance of the asset, focusing on potential future movements.
This technical analysis delves into the recent trends observed in the NASDAQ 100 Index, focusing on
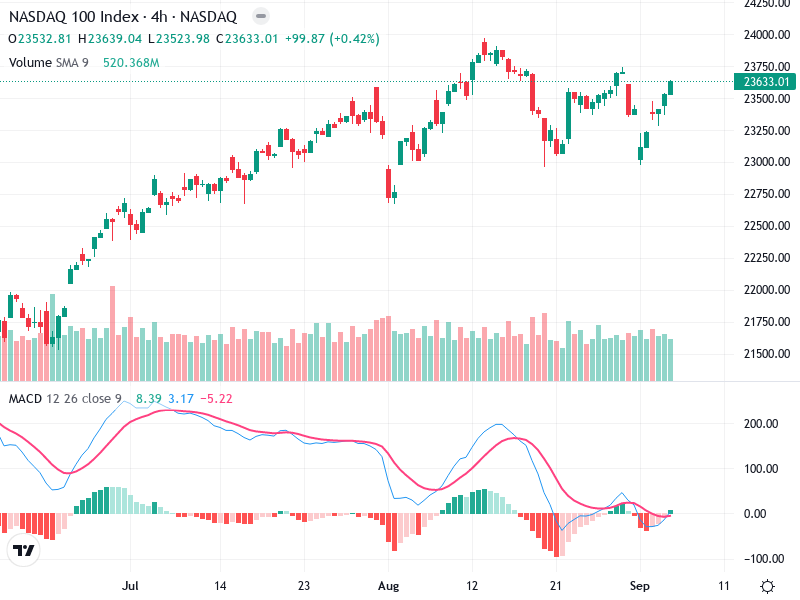
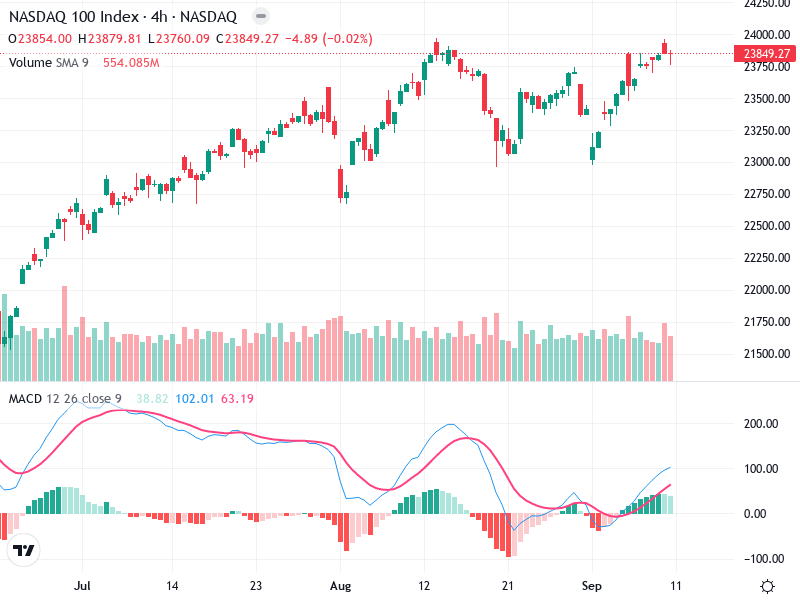
The chart indicates a recent uptrend after a period of correction. A potential breakout zone has

The NASDAQ 100 Index is showing significant potential for change according to the latest technical patterns.
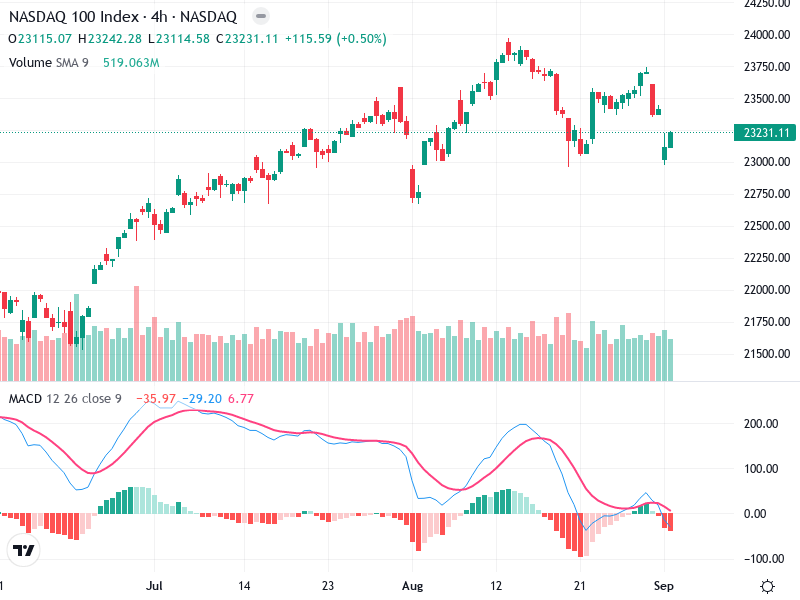
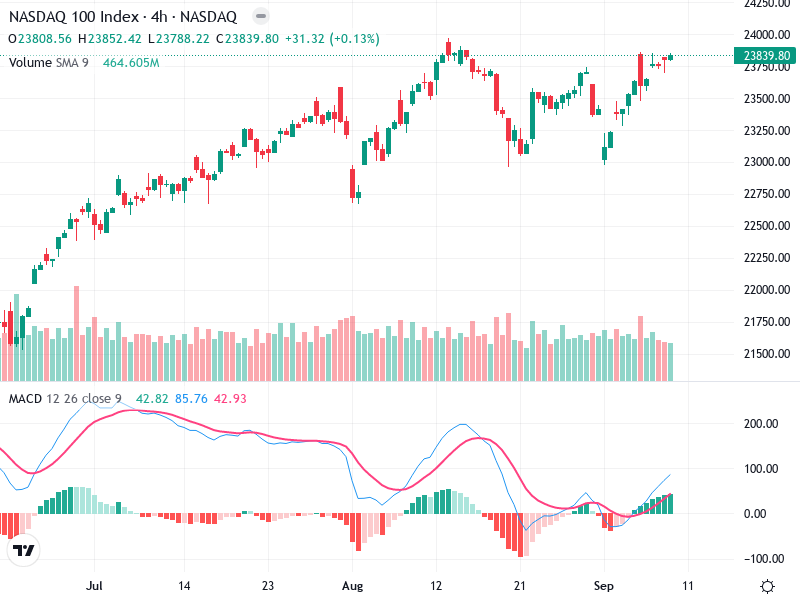
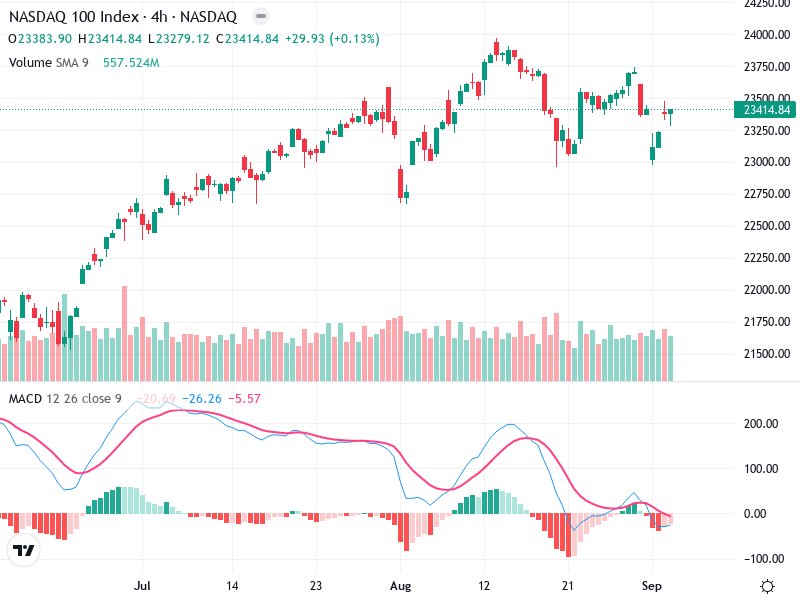
The NASDAQ 100 Index is exhibiting a mix of slight bearish tendencies with a potential for
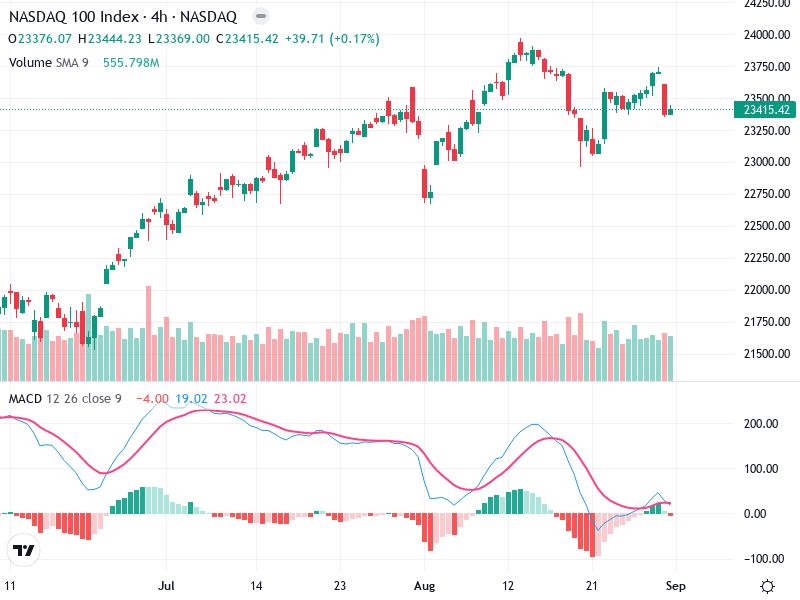
The NASDAQ 100 Index is showcasing a predominantly bullish trend since mid-August. A closer inspection reveals
