
NSDQ – Technical Analysis – 4h
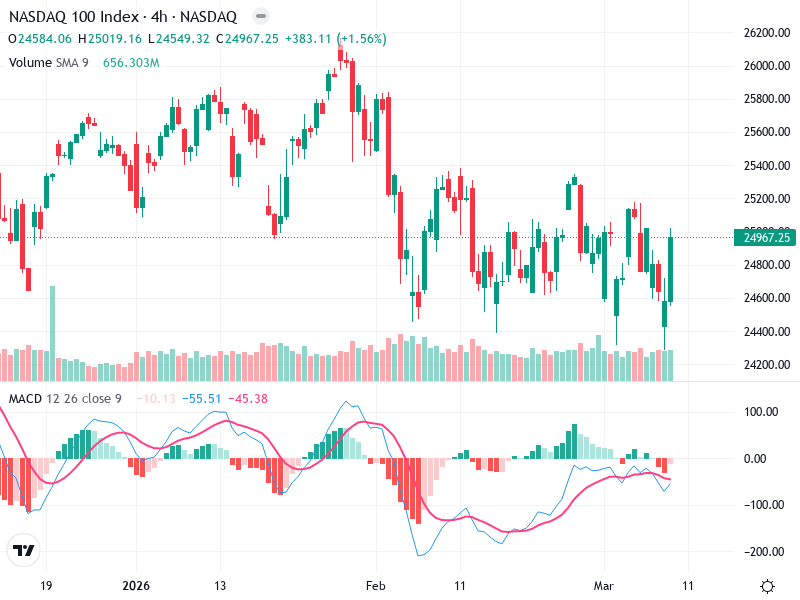
The NASDAQ 100 Index shows a cautious market sentiment with a downside risk bias. Although there
The NASDAQ 100 Index shows a cautious market sentiment with a downside risk bias. Although there

The chart shows a consolidated trend with a slight bearish inclination, reflecting a market lacking clear

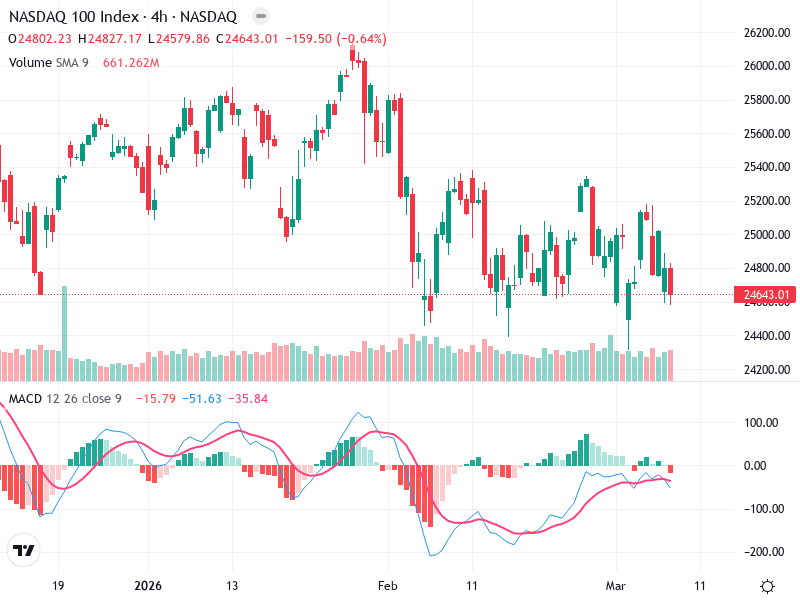
The NASDAQ 100 Index is currently exhibiting various technical signals. The 4-hour chart shows a mixture
The NASDAQ 100 index chart indicates sideways movement recently. However, recent bullish momentum is evident with
The NASDAQ 100 Index 4-hour chart reveals mixed candlestick patterns with no clear bullish or bearish
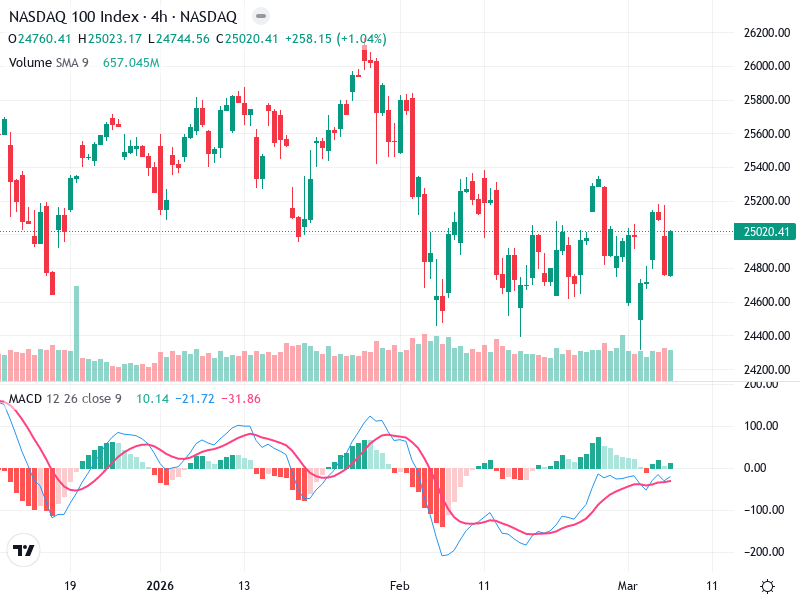
The NASDAQ 100 Index chart reveals intriguing patterns across technical indicators. Recent candlestick formations, alongside MACD
The asset is showing signs of consolidation, with the potential for a breakthrough above key resistance

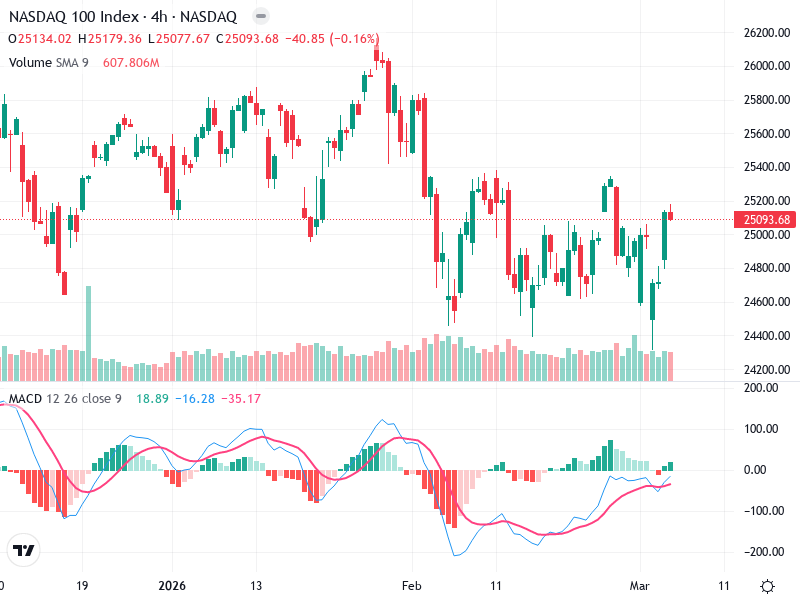
The NASDAQ 100 Index is showing mixed signals on its 4-hour chart. Recent price action points

The asset displays a mixture of candlestick patterns reflecting market indecision. Recent price action suggests a

The NASDAQ 100 Index is currently exhibiting a sideways trading pattern, fluctuating between key support and
