NSDQ – Technical Analysis – 4h
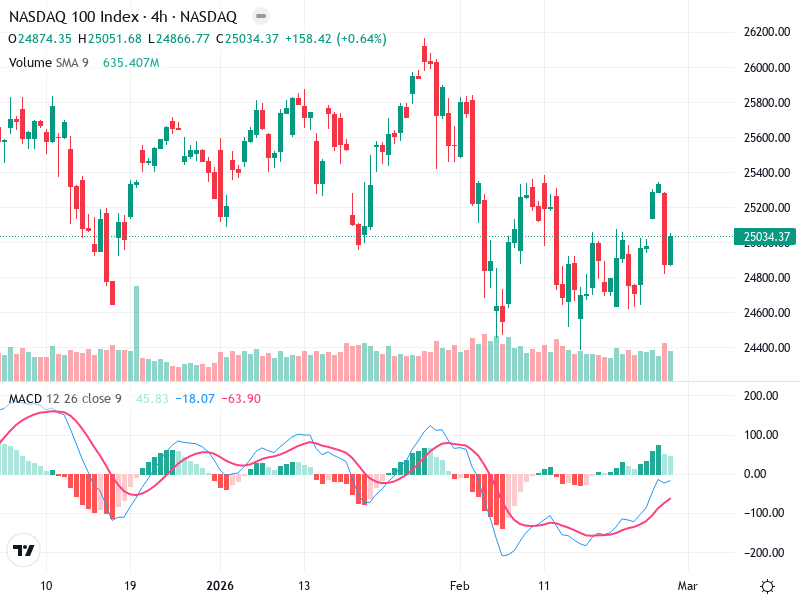
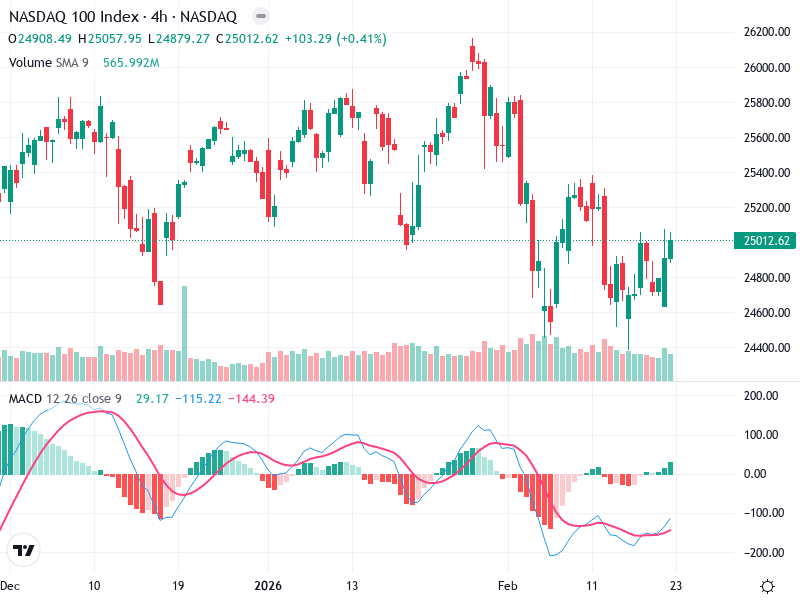
The NASDAQ 100 Index is showing signs of recovery on the 4-hour chart. Recent sessions have
The NASDAQ 100 Index is showing signs of recovery on the 4-hour chart. Recent sessions have
The analysis indicates a cautious bullish outlook for the asset. Key levels are being tested, suggesting
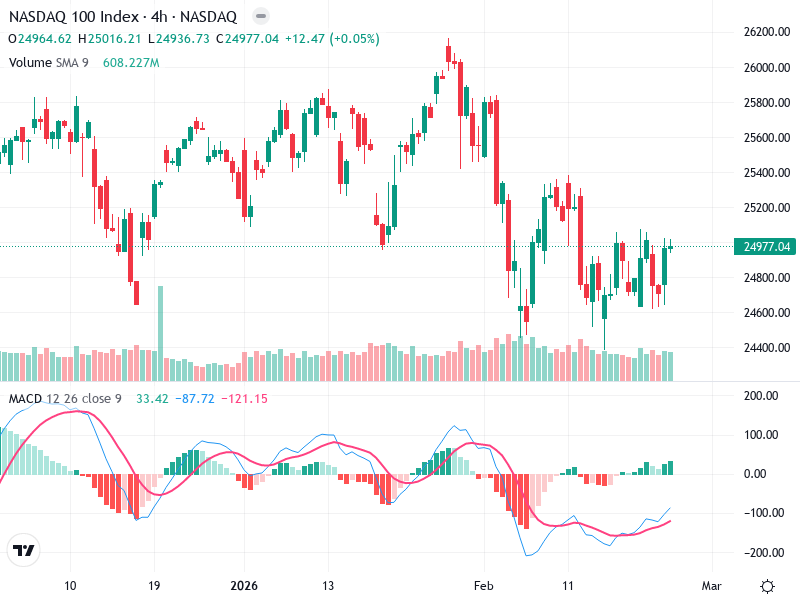
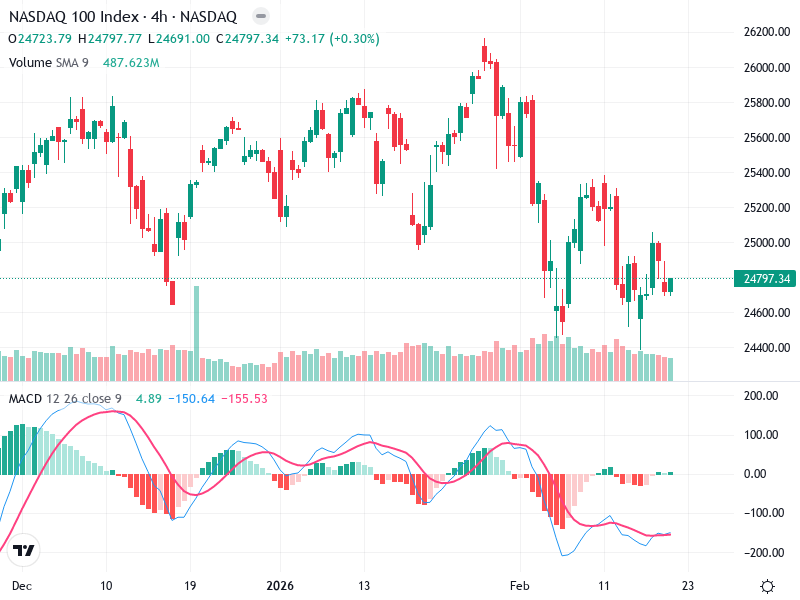
The asset is currently showing mixed signals with potential for future movement. Key technical indicators suggest
The chart currently shows a sideways trend with periods of both bullish and bearish activity. This
The chart for this asset indicates a primarily sideways trend with both upward and downward price
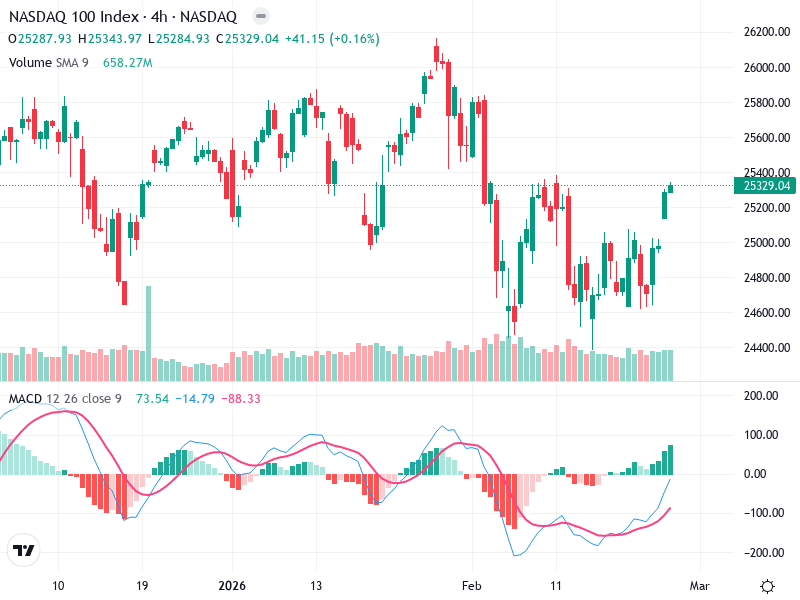
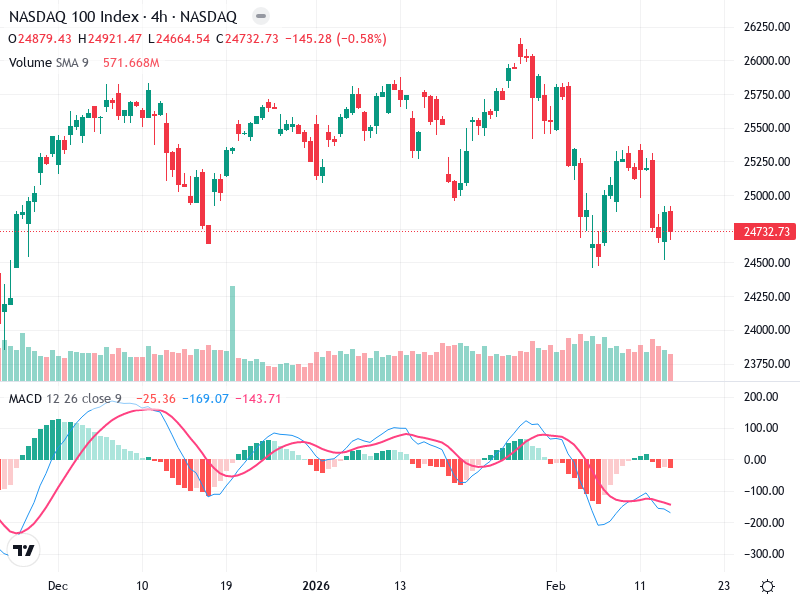
The NASDAQ 100 Index chart illustrates a recent bullish rebound from a low point. The index
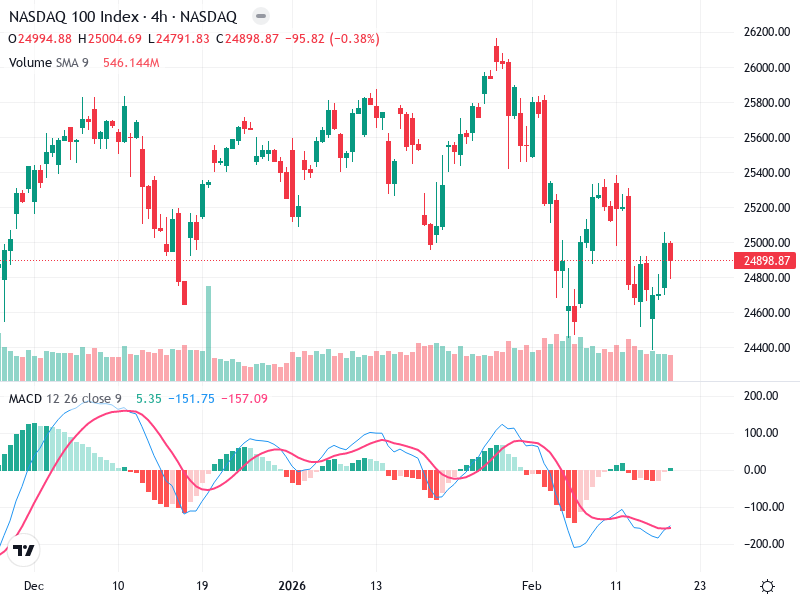
The NASDAQ 100 Index has displayed interesting movements recently, indicating potential trading opportunities. The combination of
The chart shows significant trends in the market. Current patterns indicate potential shifts in momentum. Key
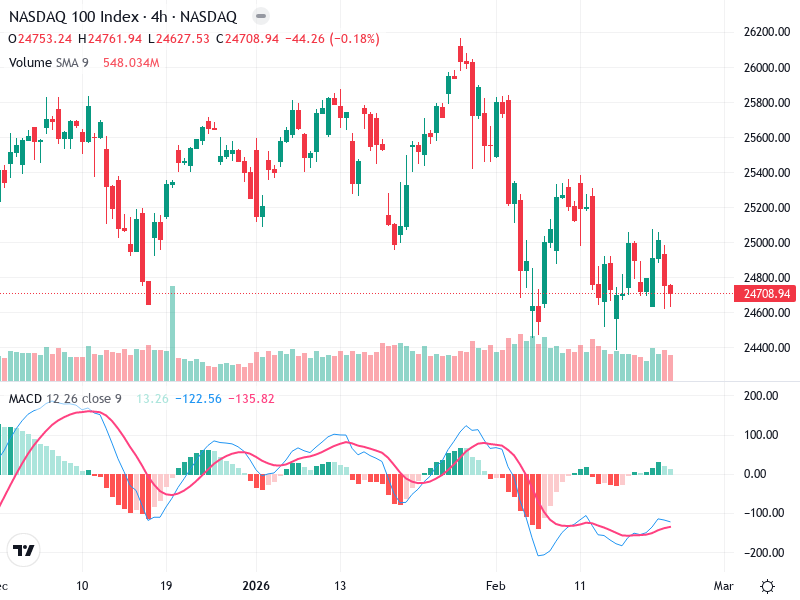
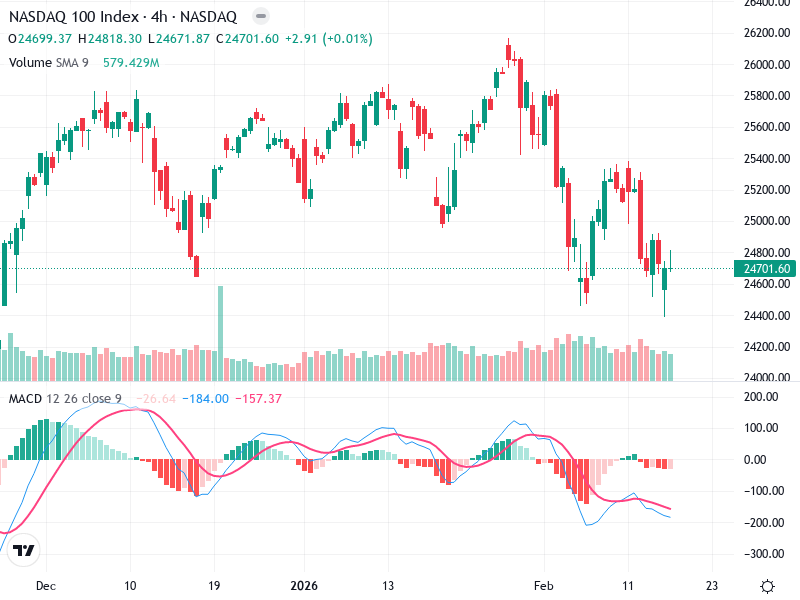
The chart analysis for highlights significant patterns in candlestick formations and technical indicators. Currently, a bearish

The current technical analysis of the asset shows a bearish sentiment prevailing in the market. Lower

