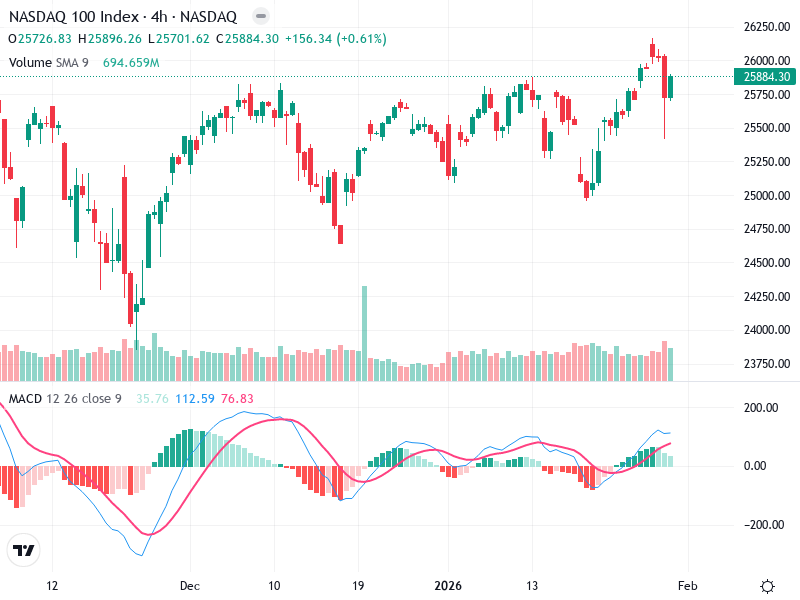
NSDQ – Technical Analysis – 4h
The NASDAQ 100 Index has been showcasing interesting patterns in recent sessions. The asset is nearing
The NASDAQ 100 Index has been showcasing interesting patterns in recent sessions. The asset is nearing
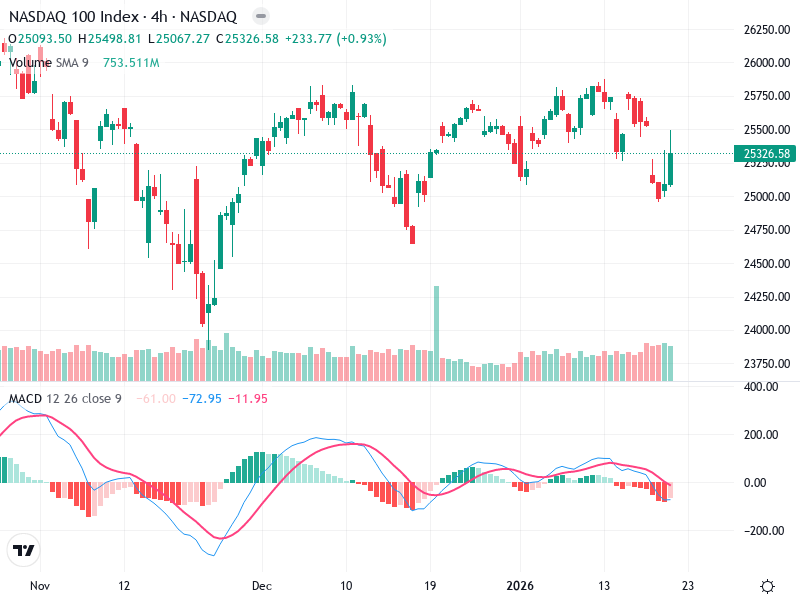
The asset chart shows a significant bullish trend after a decisive breakout above previous resistance levels.
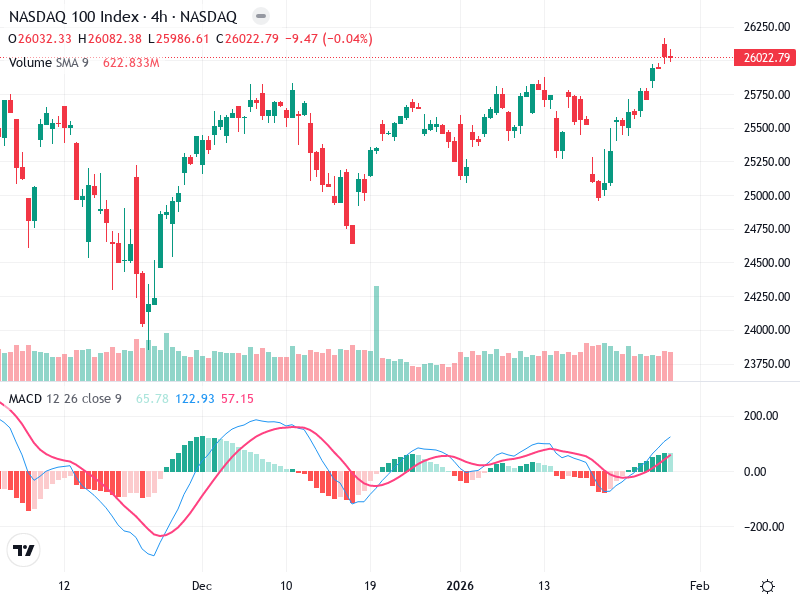
The NASDAQ 100 Index is displaying strong bullish momentum in recent charts. Key patterns and indicators
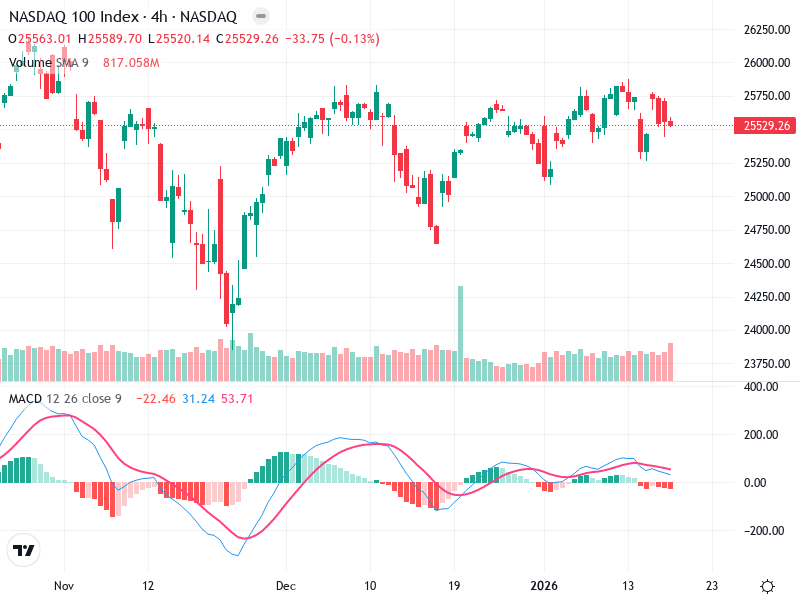
The NASDAQ 100 Index 4-hour chart indicates bullish momentum in the short term. Traders are closely
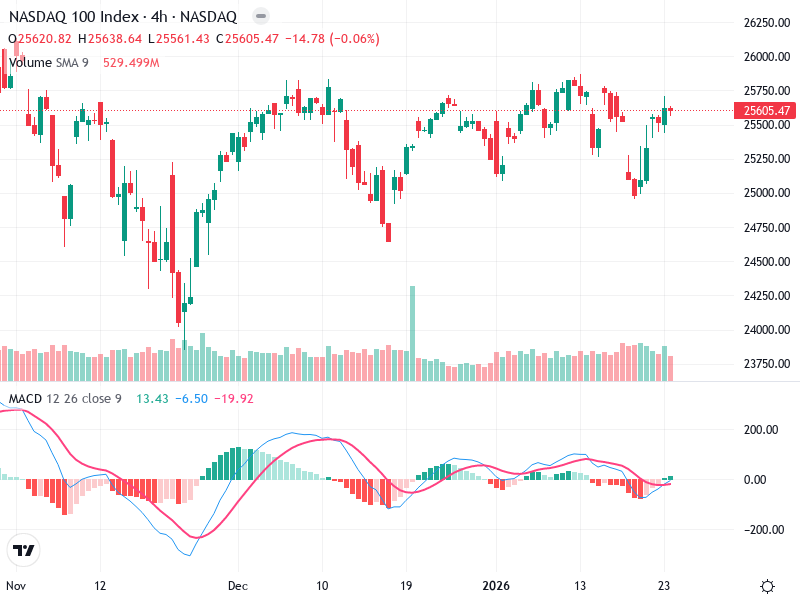
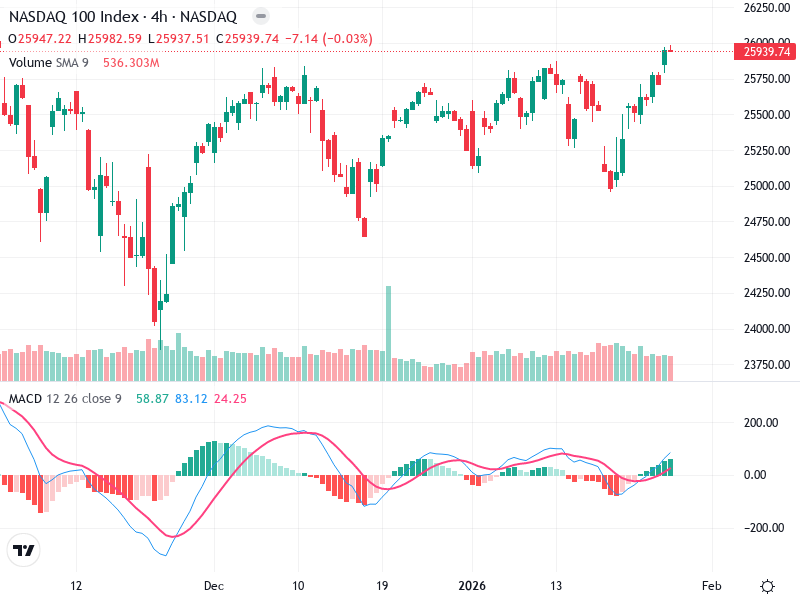
The NASDAQ 100 Index chart indicates a predominantly sideways movement with both bullish and bearish tendencies.
The NASDAQ 100 Index chart presents a sideways trend with fluctuating bullish and bearish phases. A
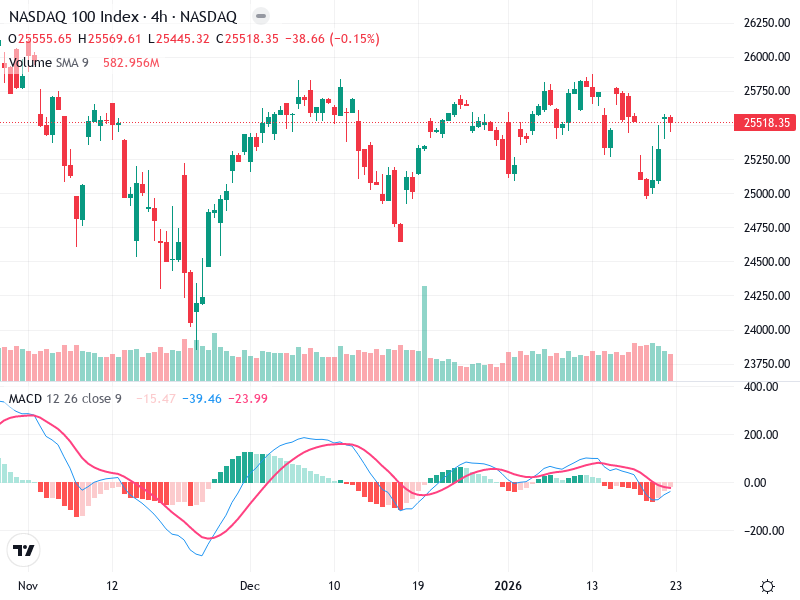
The NASDAQ 100 Index chart indicates a period of volatility with recent movements attempting a bullish
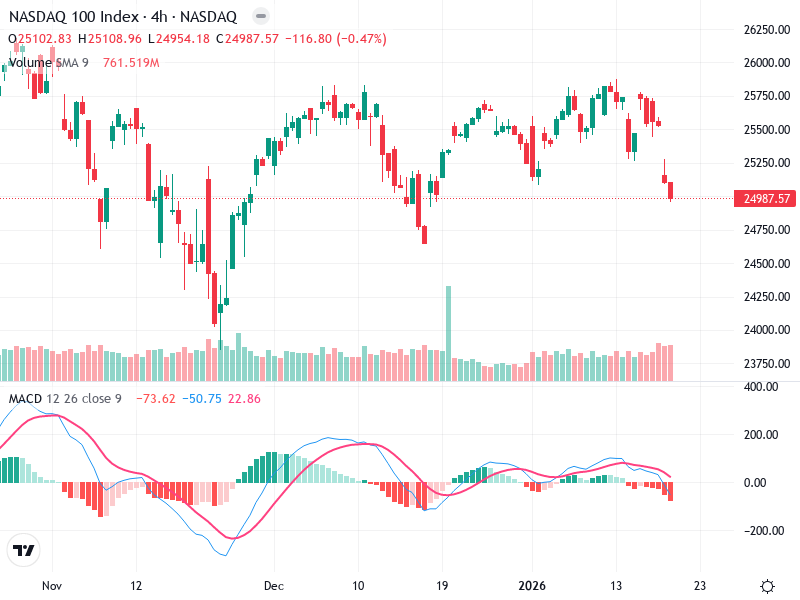
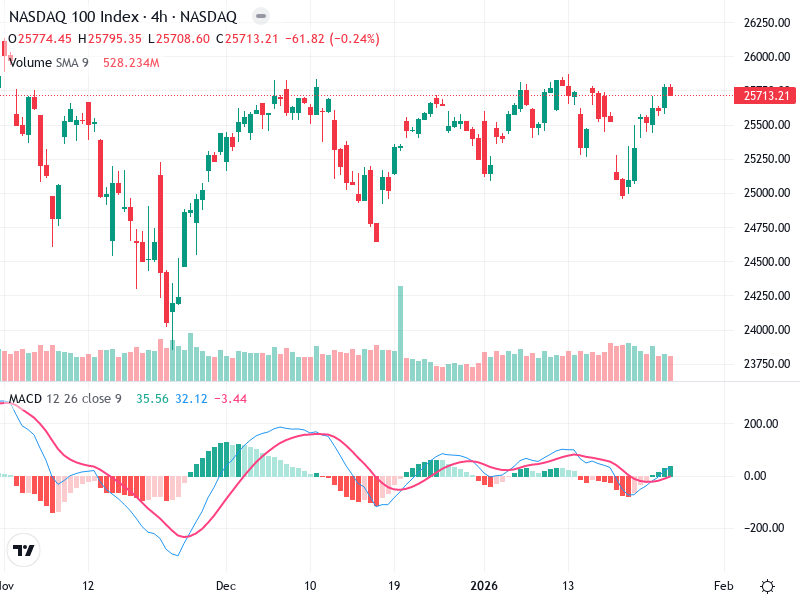
The NASDAQ 100 Index chart showcases a predominantly bearish trend. With significant downward momentum driven by
The current analysis for Asset presents a cautious approach towards its pricing behavior. The chart shows

The chart presents an overview of the recent performance of the asset. Periodic shifts in the
