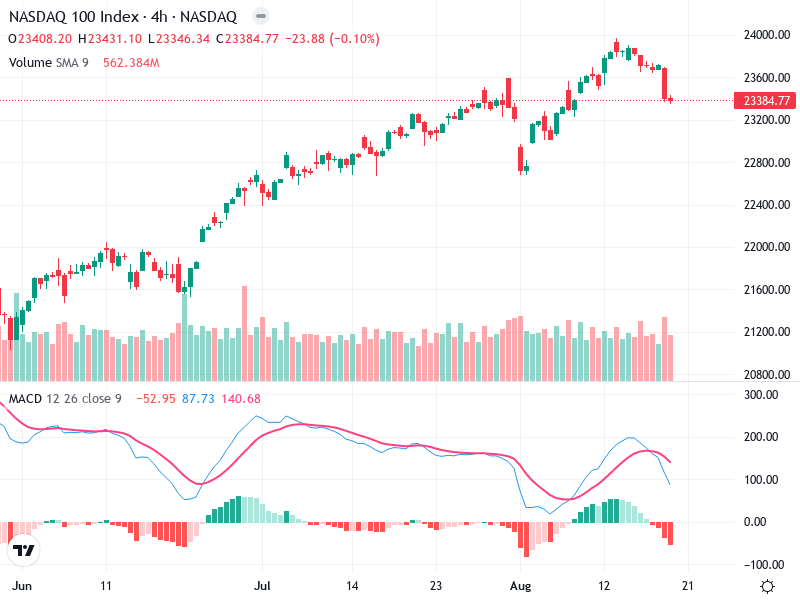
NSDQ – Technical Analysis – 4h
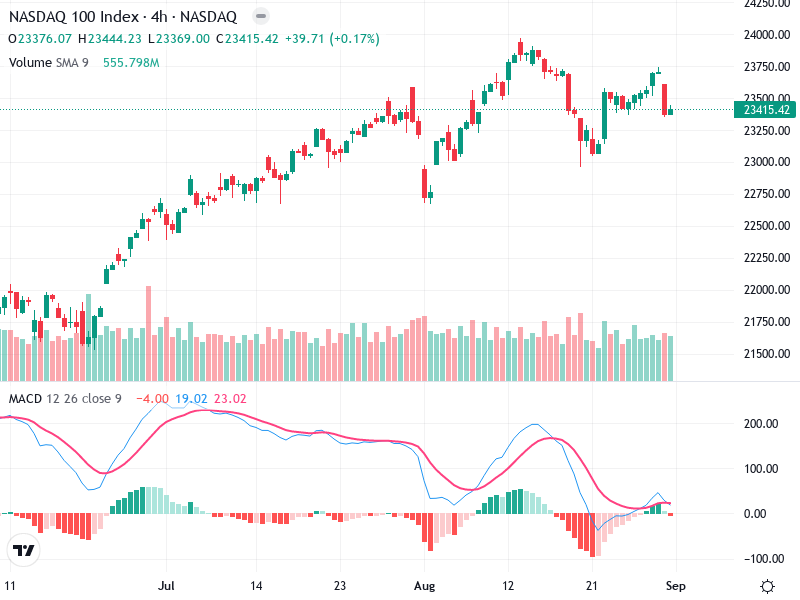
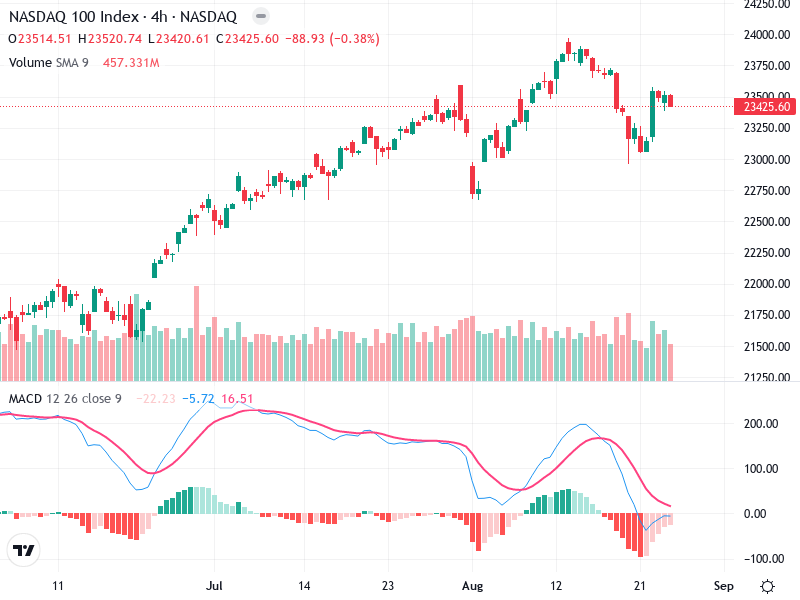
The NASDAQ 100 Index 4-hour chart currently exhibits a bullish trend with consistent upwards movement. Despite

September 1, 2025
The NASDAQ 100 Index 4-hour chart currently exhibits a bullish trend with consistent upwards movement. Despite
The chart of the NASDAQ 100 Index reveals clear trends and patterns that are critical for
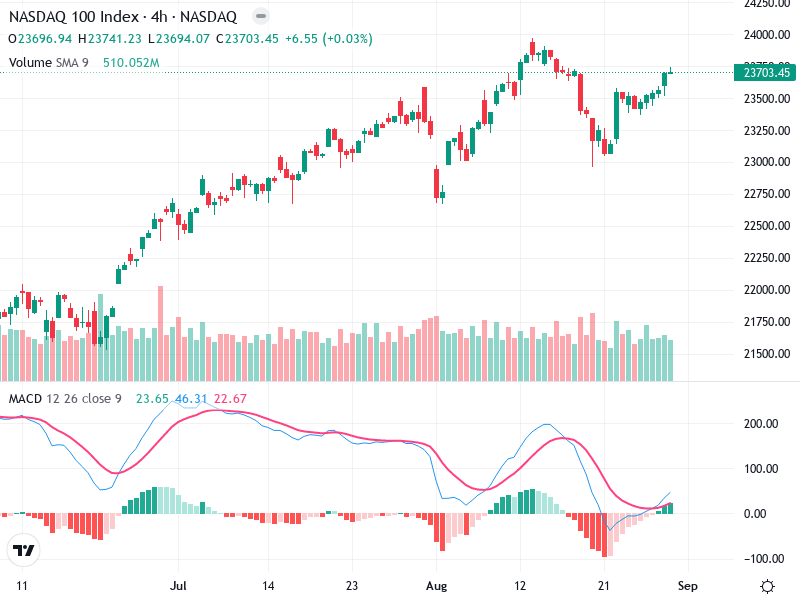
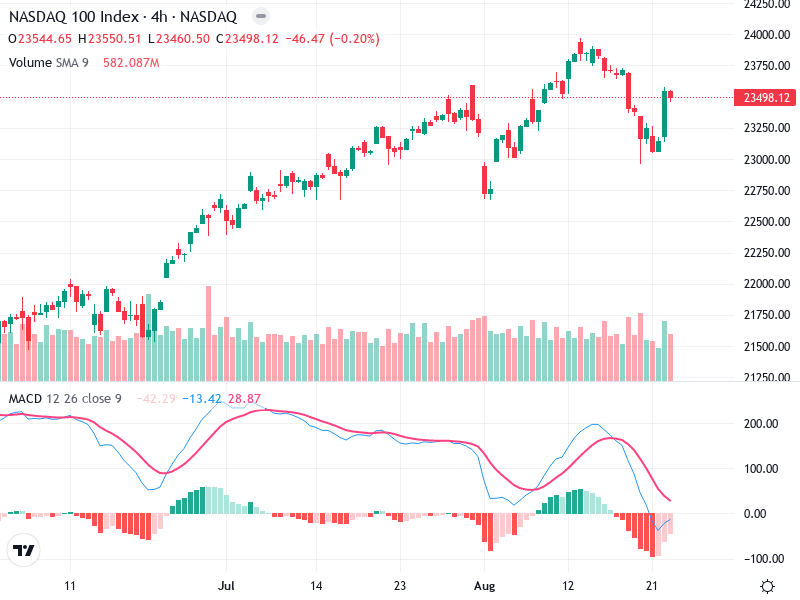
The NASDAQ 100 Index is currently exhibiting interesting chart patterns, highlighted by a mix of bullish
The NASDAQ 100 Index is currently displaying signs of potential bullish momentum on the 4-hour chart.
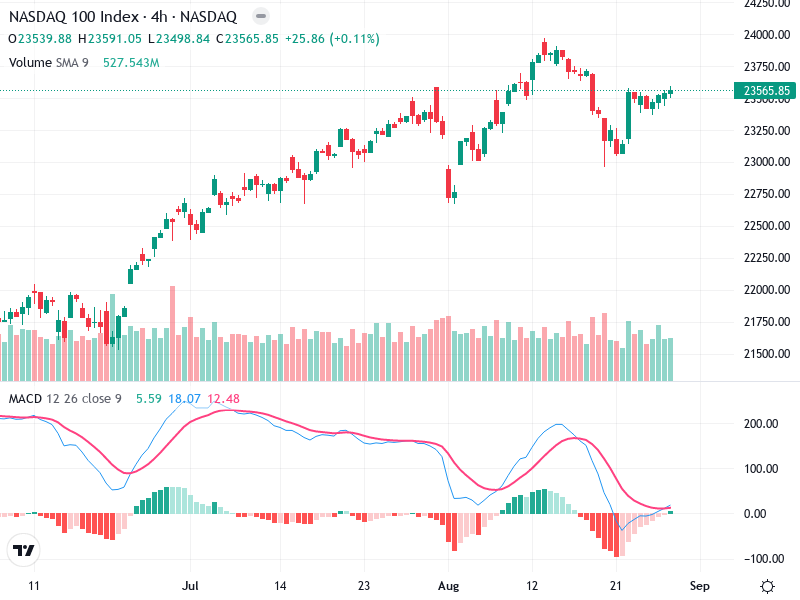
The chart shows historical price movements and potential future directions. It highlights key technical indicators that
The chart of NASDAQ 100 Index reveals an ongoing uptrend dating back to mid-July, indicating a
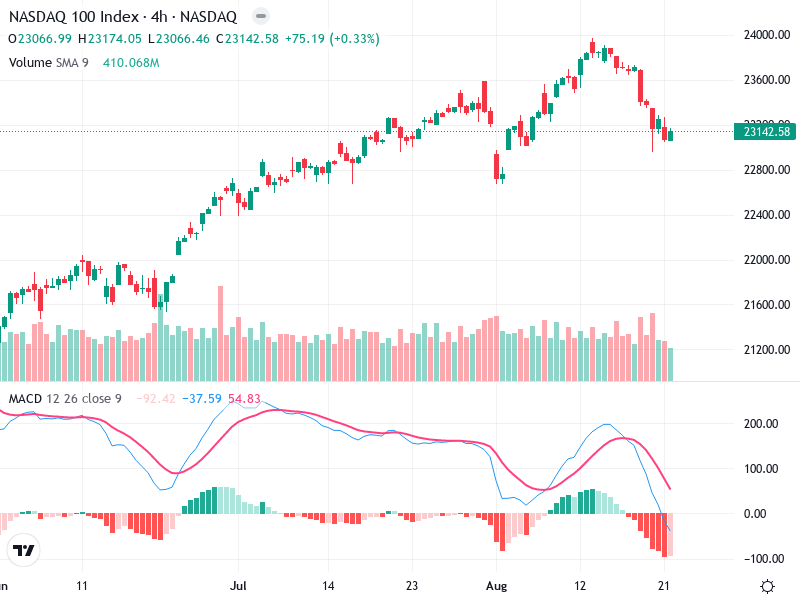
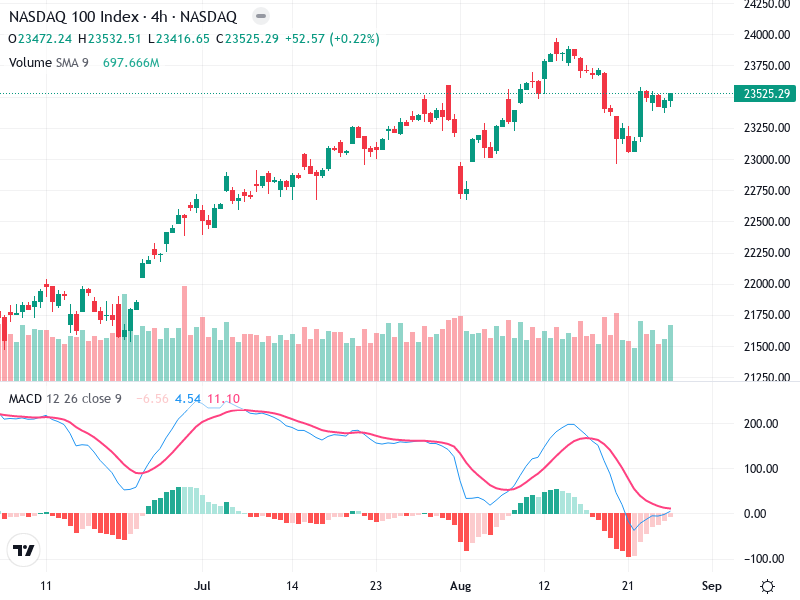
The chart exhibits a marked shift in trend, transitioning from a prolonged uptrend to a recent
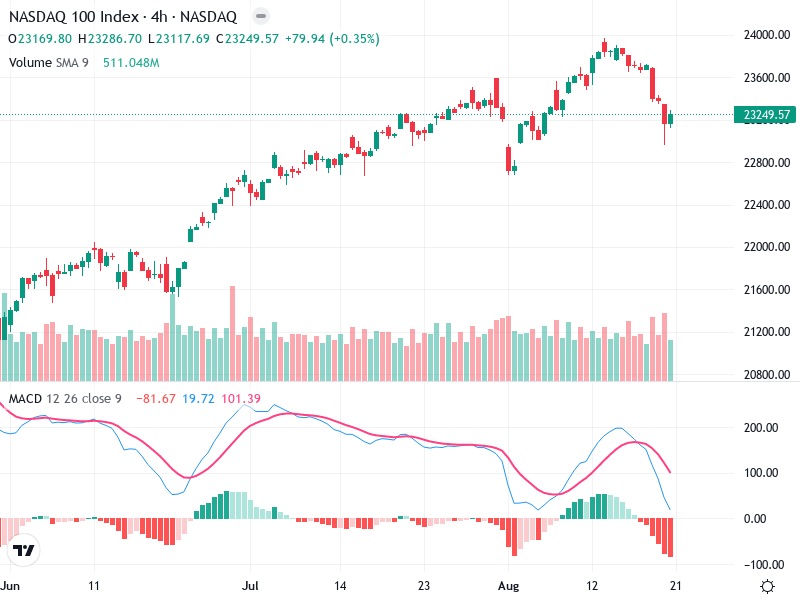
The chart shows a strong bullish trend that developed from mid-July to early August. However, a
The analysis focuses on evaluating the recent price movements and predicting future trends. It includes a
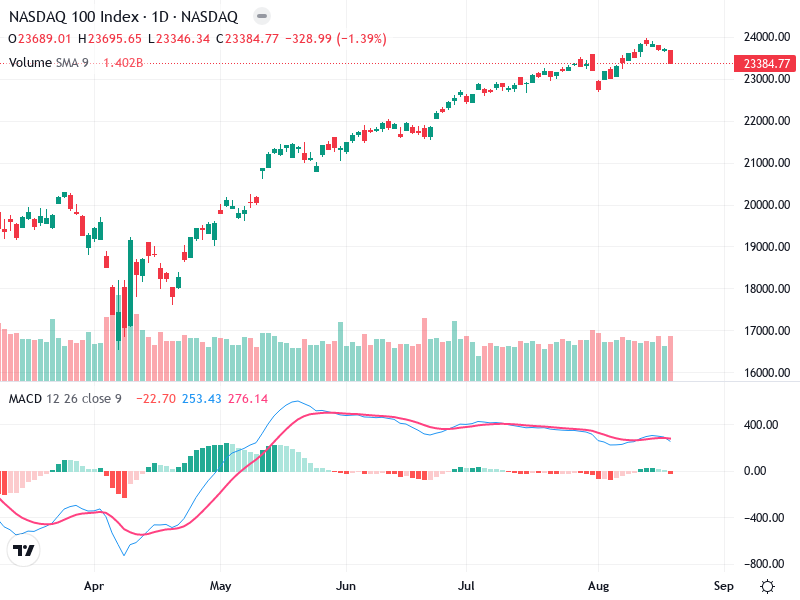
The NASDAQ 100 Index has experienced a sustained upward trend over the past several months, but
