GOLD – Technical Analysis – 4h
The chart presents a comprehensive view of the market dynamics, highlighting key technical indicators and patterns.
The chart presents a comprehensive view of the market dynamics, highlighting key technical indicators and patterns.
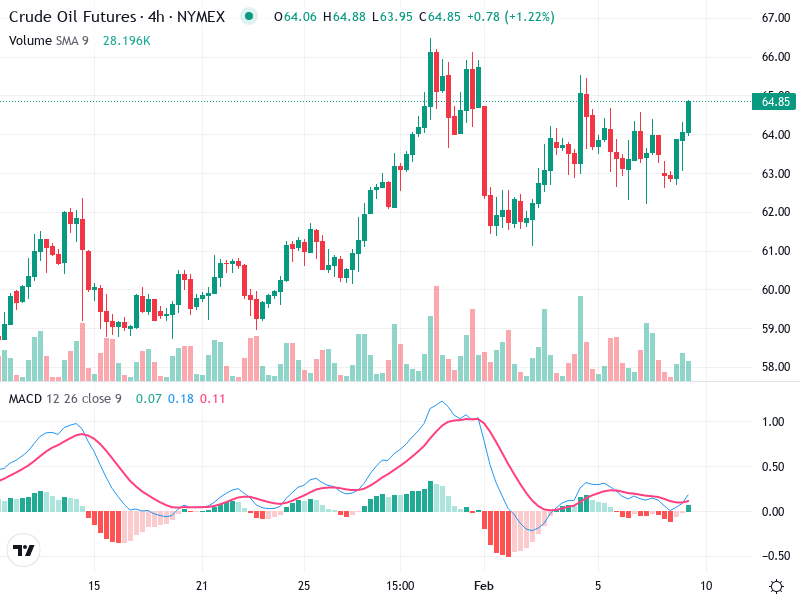
The Crude Oil Futures chart on the 4-hour timeframe indicates a predominantly bullish trend. There have
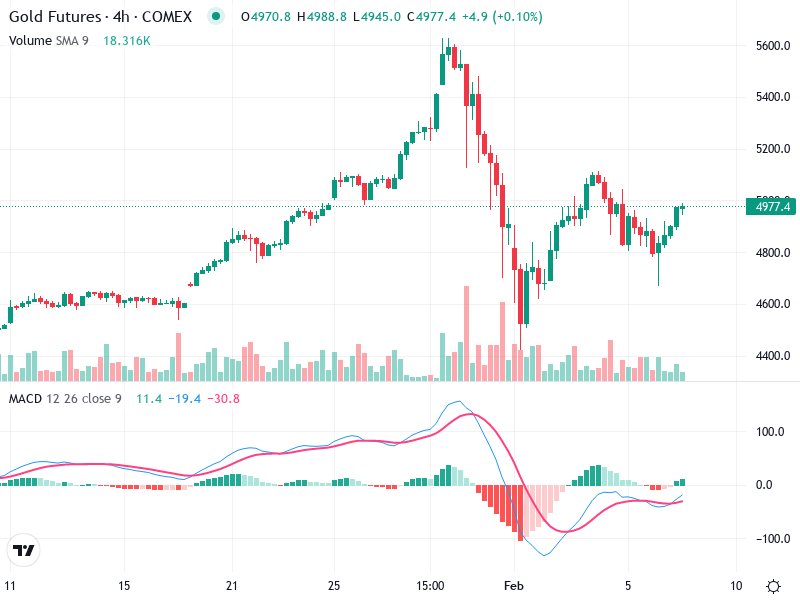
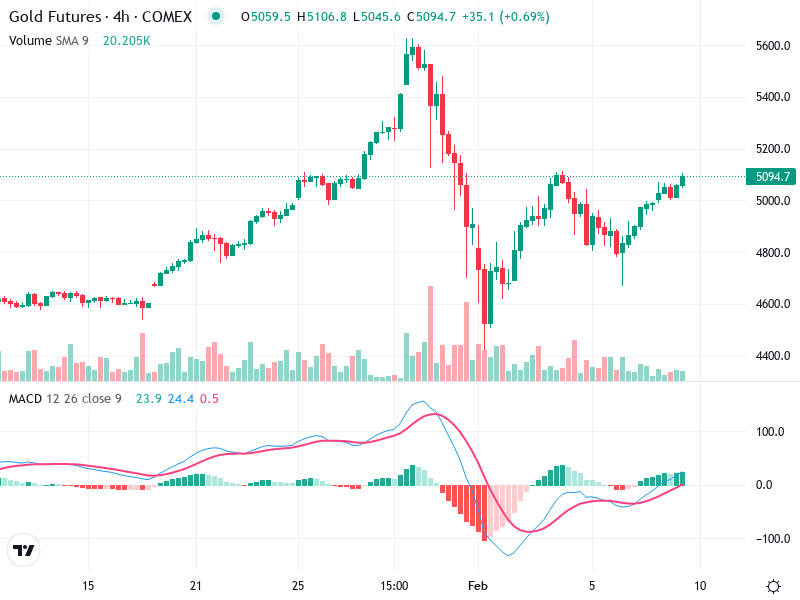
The Gold Futures 4-hour chart reveals key market dynamics. Recently, the chart exhibited alternating bullish and

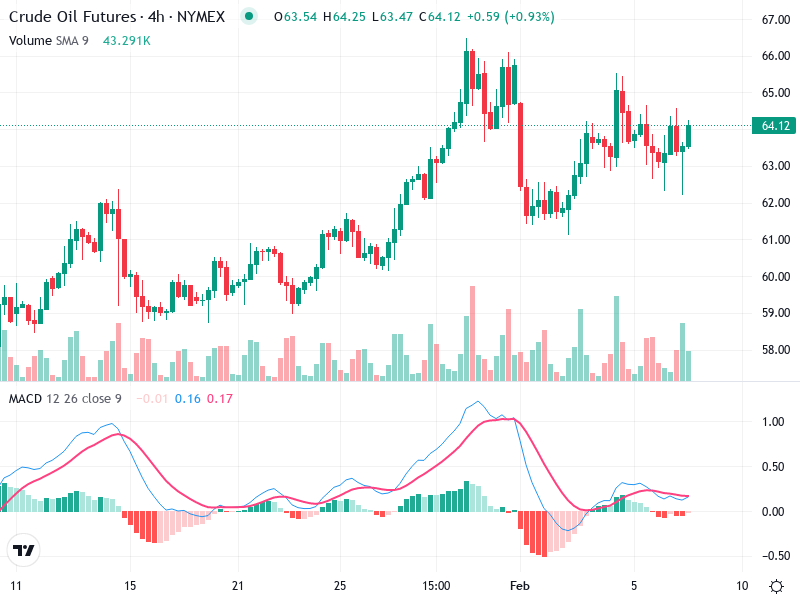
The Crude Oil Futures chart reveals an intriguing market scenario. Initial bullish movements have been followed
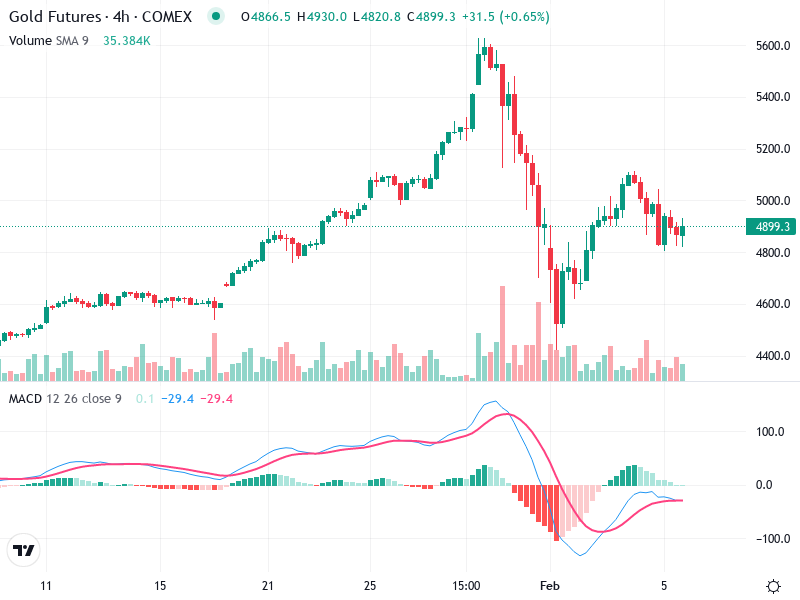
The Gold Futures chart shows recent market activities and key levels to watch. There’s an observable
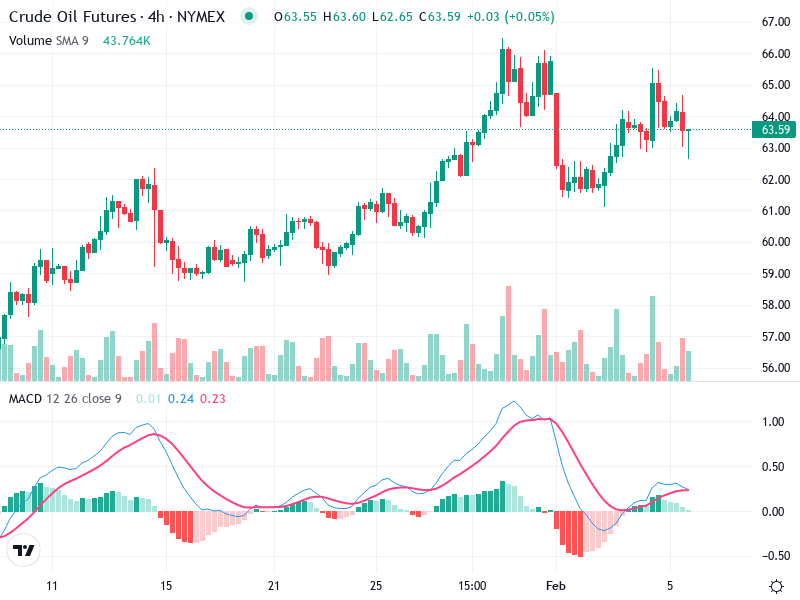
The Crude Oil Futures chart presents a bullish trend with consolidation. Recent candlestick patterns show indecisive
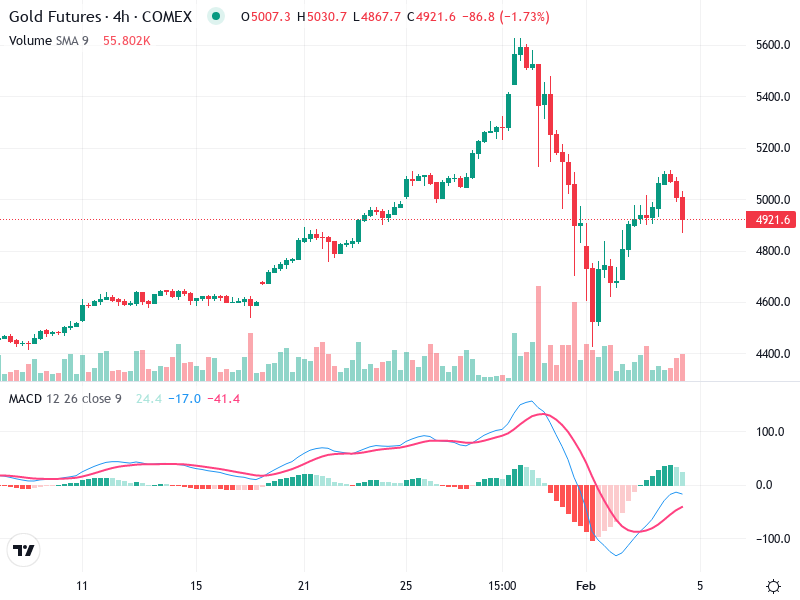
The Gold Futures 4-hour chart shows interesting patterns with recent bearish activity. Despite a strong uptrend,
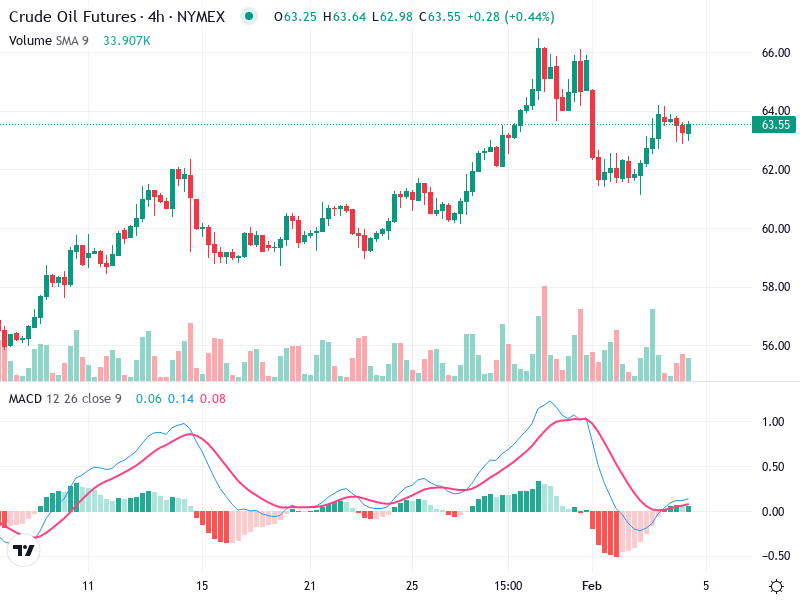
The chart for Crude Oil Futures reflects a cautiously bullish outlook. Recent trends highlight higher highs
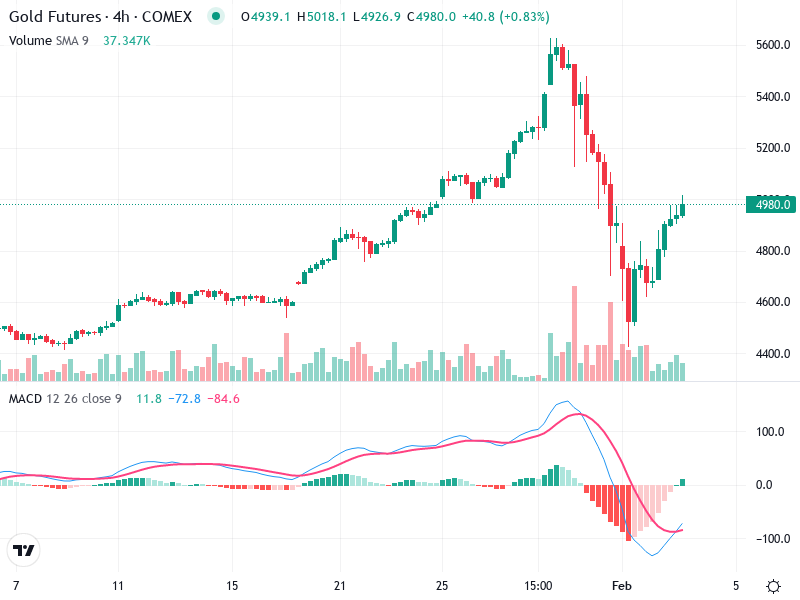
The chart displays a dynamic journey for the asset, showcasing recent volatility as it navigates through
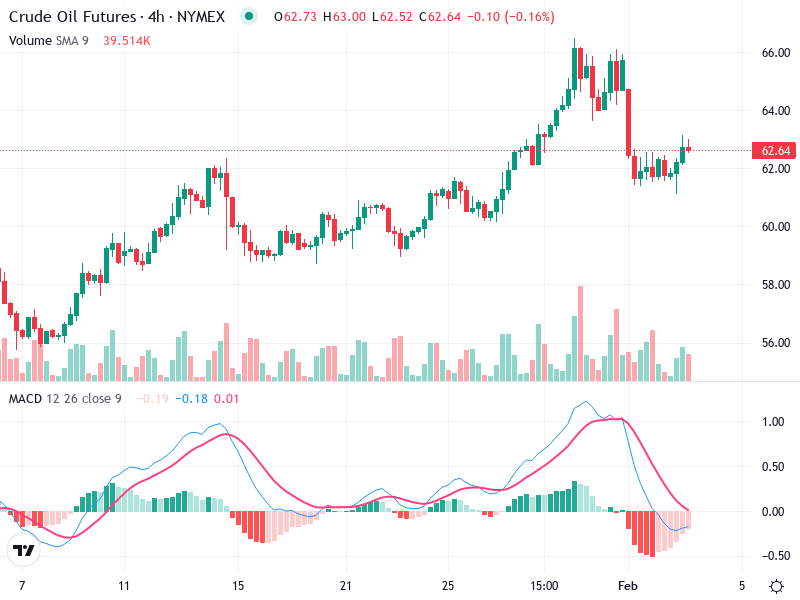
The Crude Oil Futures chart showcases a dynamic trend over recent periods. Initially bullish, the asset
