
BTC/USD – Technical Analysis – 4h
The asset exhibits bullish characteristics with potential for upward movement. The current price action suggests an
The asset exhibits bullish characteristics with potential for upward movement. The current price action suggests an

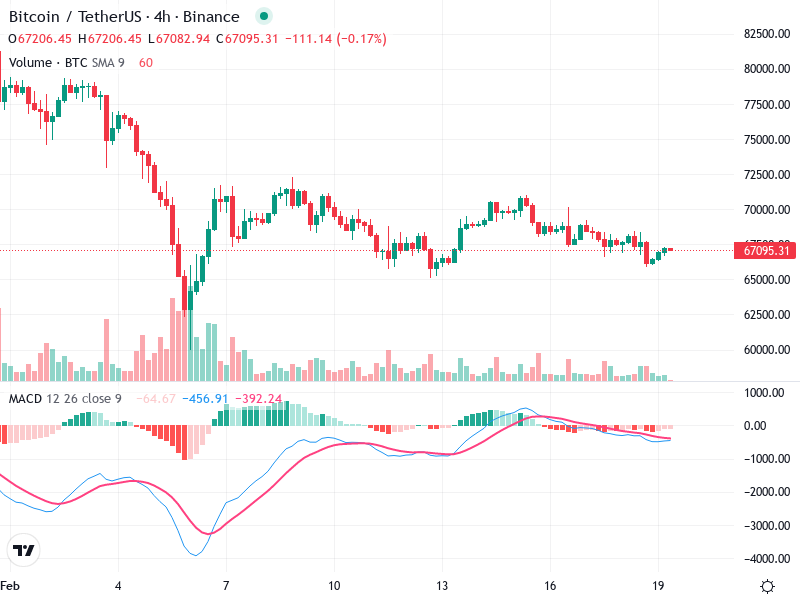
The Bitcoin/TetherUS 4-hour chart indicates a complex trading landscape. Price action is hovering near key levels,

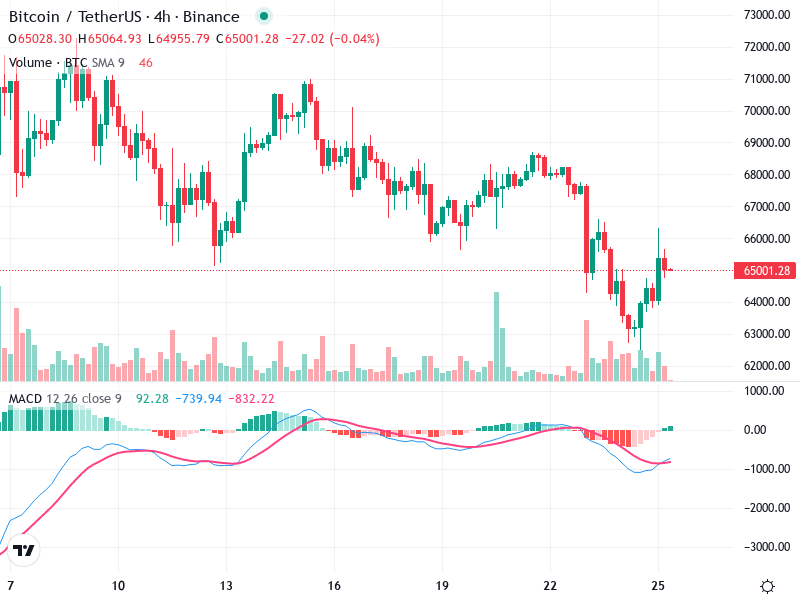
The chart for indicates a period of consolidation with significant resistance and support levels. The asset
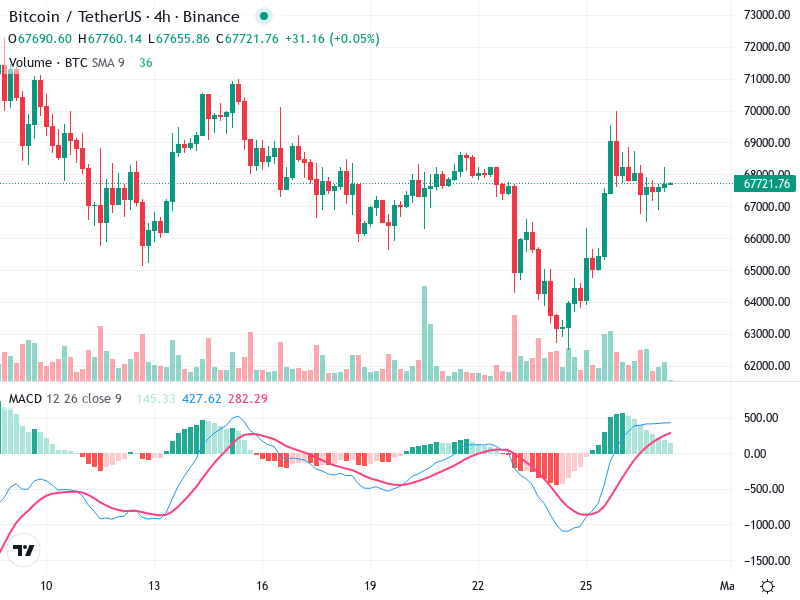
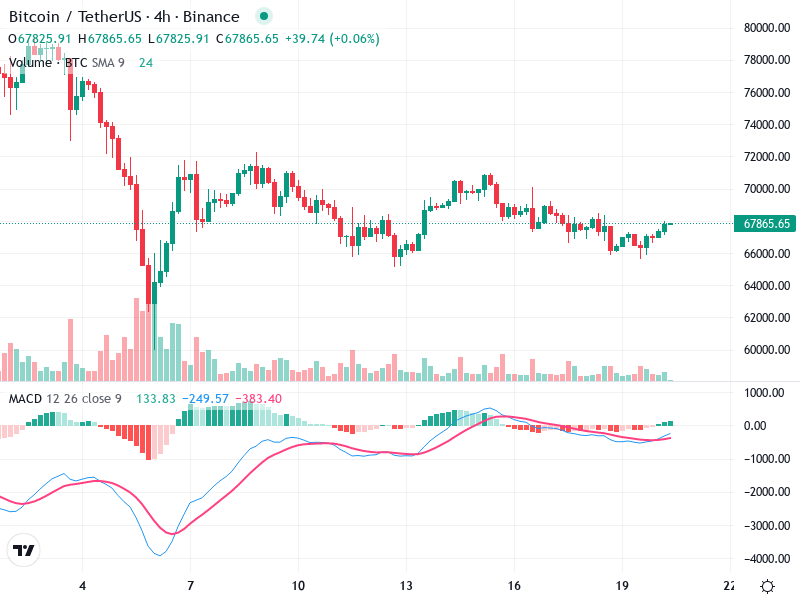
The 4-hour chart for Bitcoin/TetherUS reveals significant trends and patterns. There is a noticeable bullish recovery
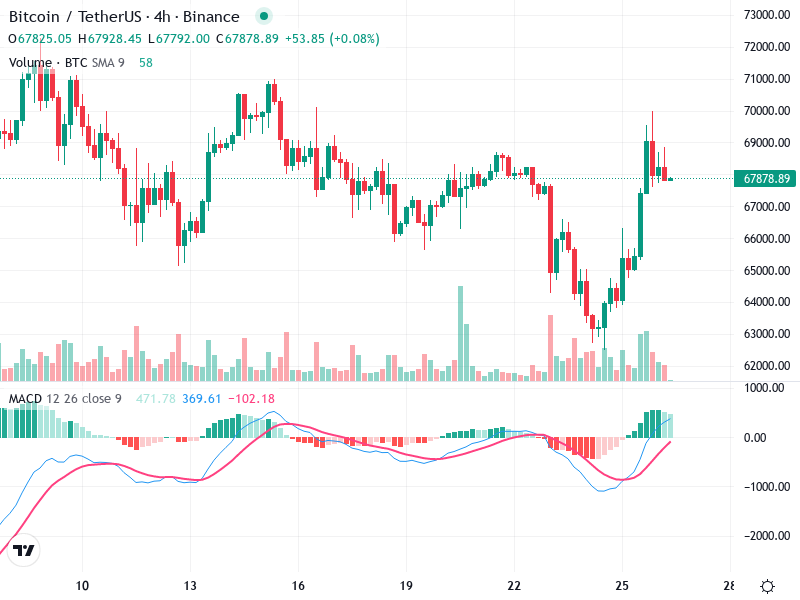
The recent chart analysis of suggests a potential bullish trend in motion. The price movements reveal
The Bitcoin/TetherUS 4-hour chart showcases potential bullish patterns with significant changes signaling a trend reversal. The
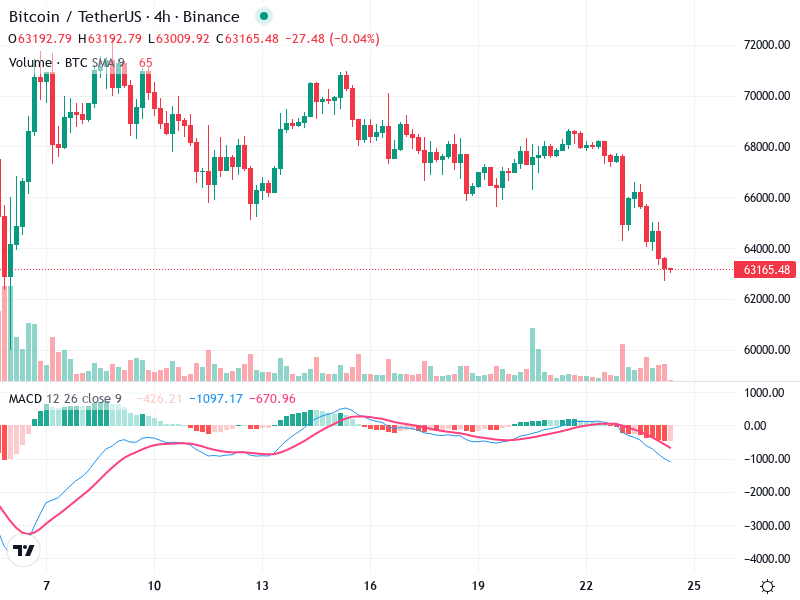
The chart reveals a significant downward trend in the asset’s price movement. The asset’s price is
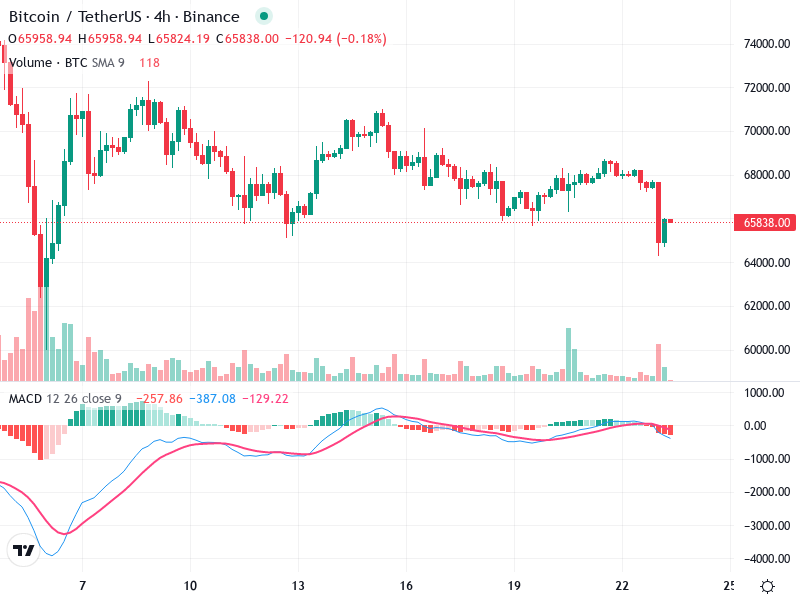
The Bitcoin / TetherUS chart reveals significant bearish indicators. Recent candlestick patterns suggest a downward trend.
The asset shows a slight bullish trend after a period of consolidation, hovering near critical levels.
The chart highlights potential turning points with notable candlestick patterns. The overall trend suggests consolidation, with
