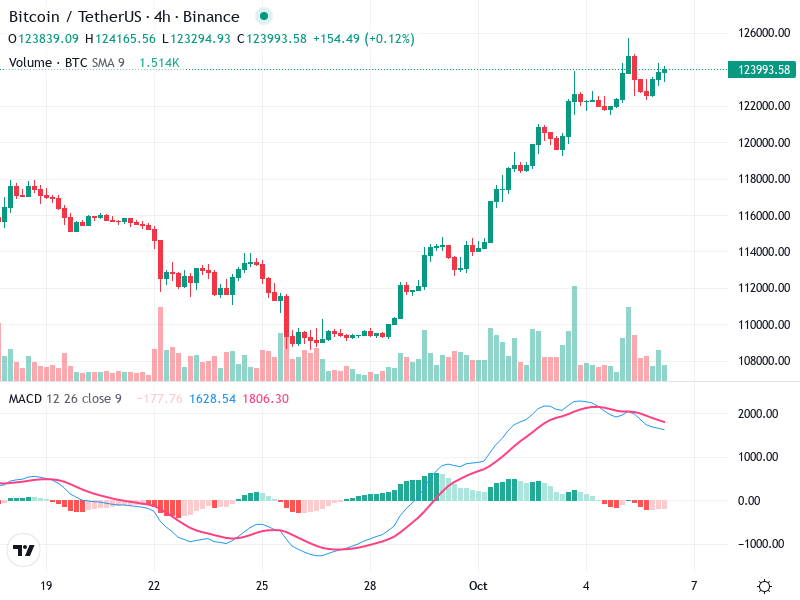
BTC/USD – Technical Analysis – 4h
The technical analysis of the asset indicates bullish trends supported by recent price actions. The asset
The technical analysis of the asset indicates bullish trends supported by recent price actions. The asset
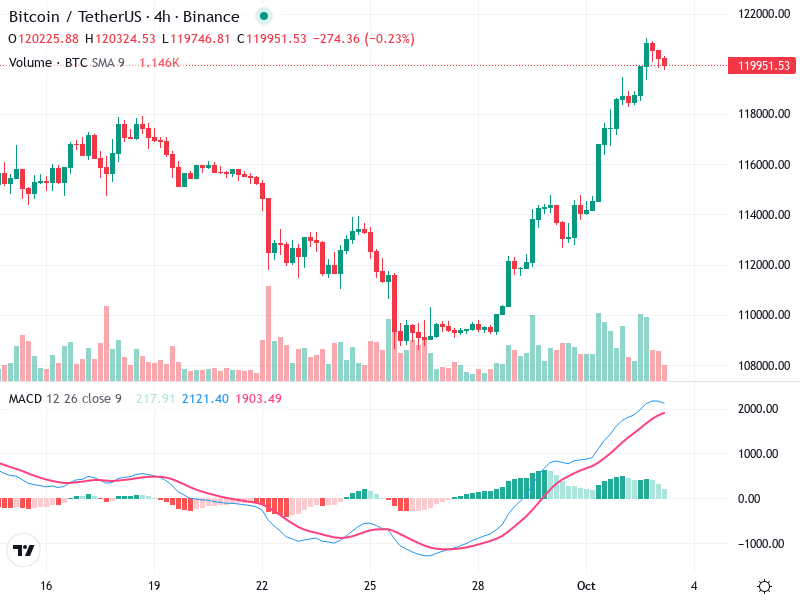
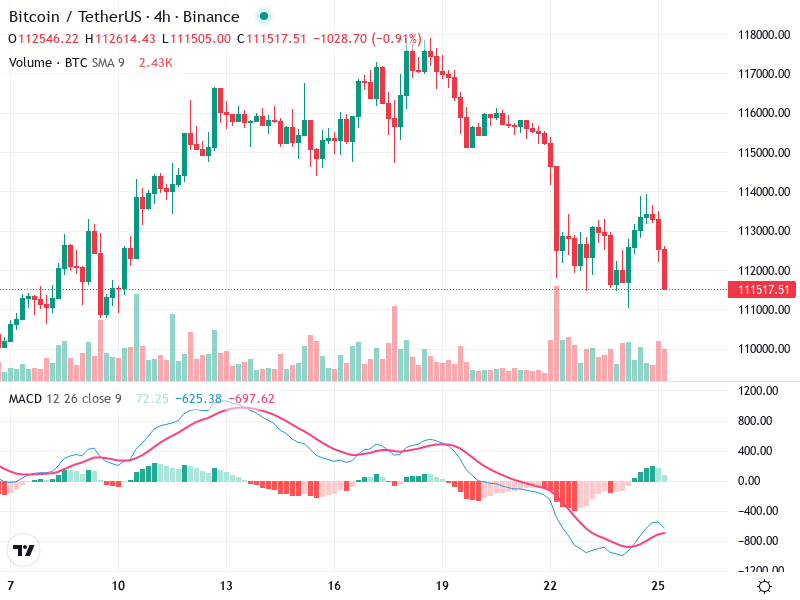
The chart for the asset demonstrates a strong upward trajectory, with significant bullish momentum noted in

The current analysis indicates a strong upward movement for . Technical indicators support a continued bullish
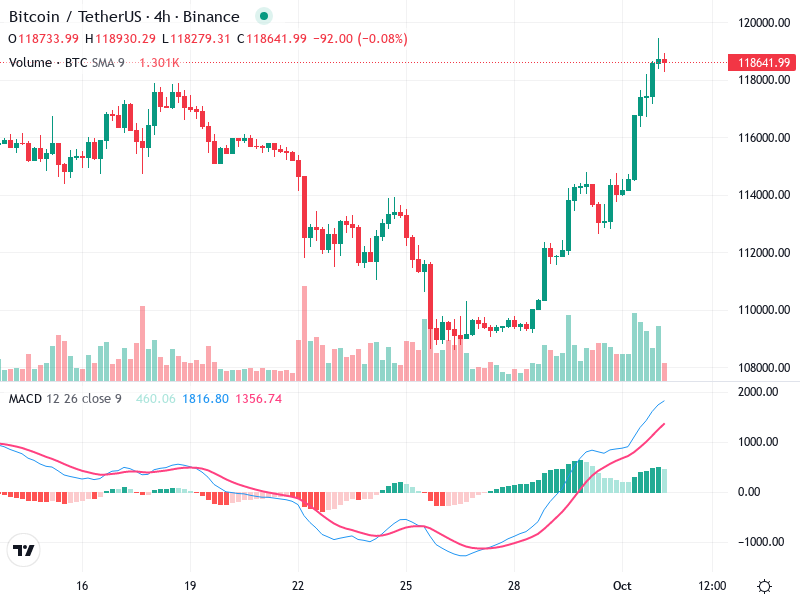
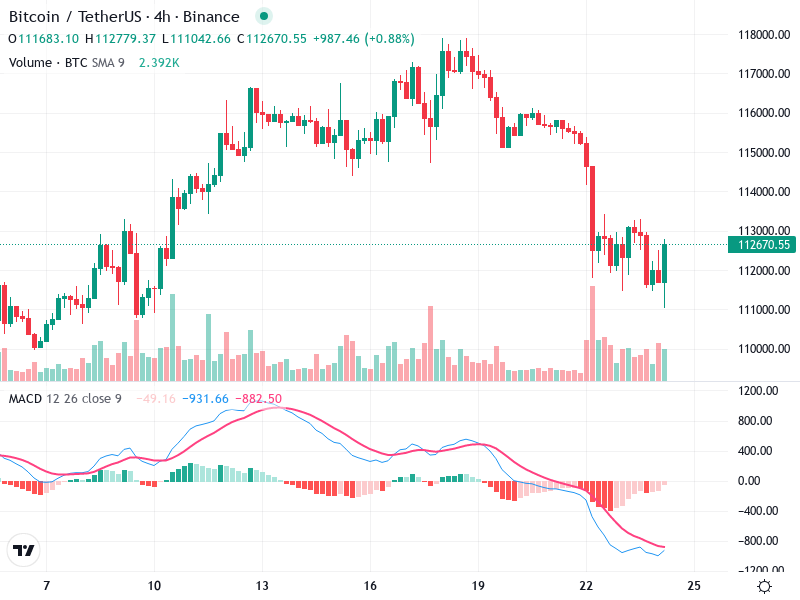
The 4-hour chart for Bitcoin/TetherUS shows a transition in trend dynamics. A notable pattern shift suggests
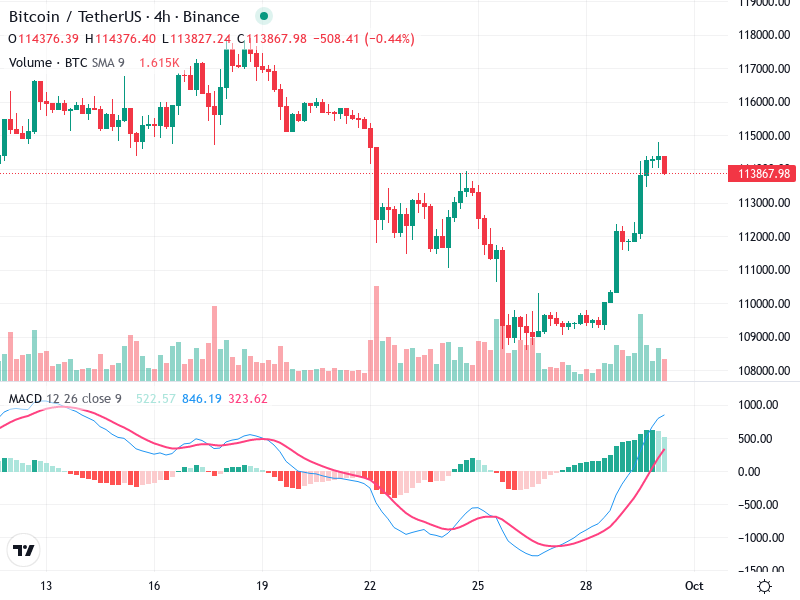
The chart of [Asset] reveals a distinct bullish momentum, originating from the market lows at the
This technical analysis provides insights into the current trends and potential future movements of Bitcoin/TetherUS on
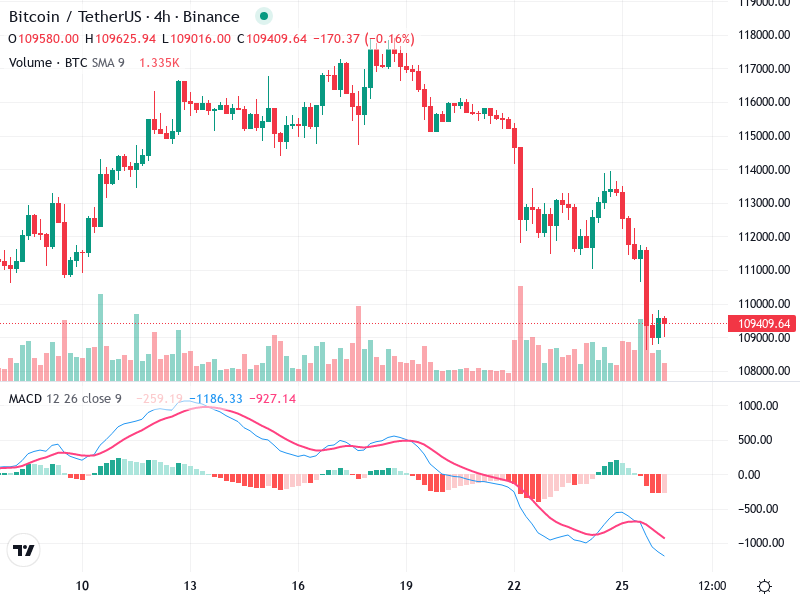
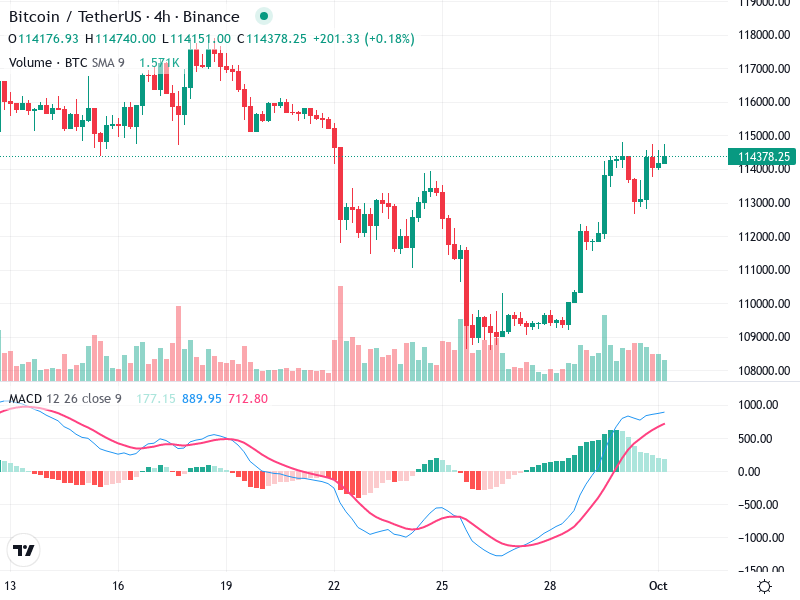
The Bitcoin/TetherUS chart is currently displaying a bearish trend with prices dropping from recent highs. Technical
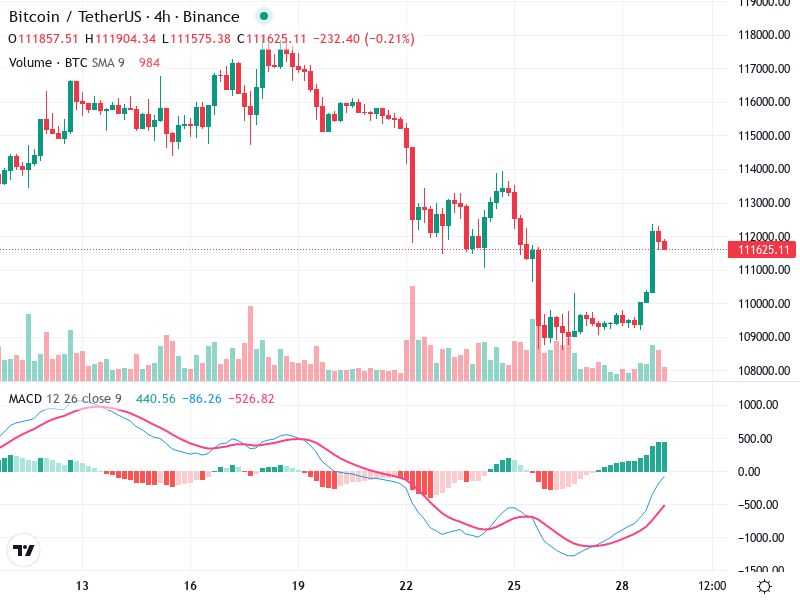
The 4-hour chart of Bitcoin against TetherUS reveals compelling insights for technical traders. The asset has
The Asset chart reveals intricate market dynamics with potential shifts. The analysis considers various indicators, suggesting
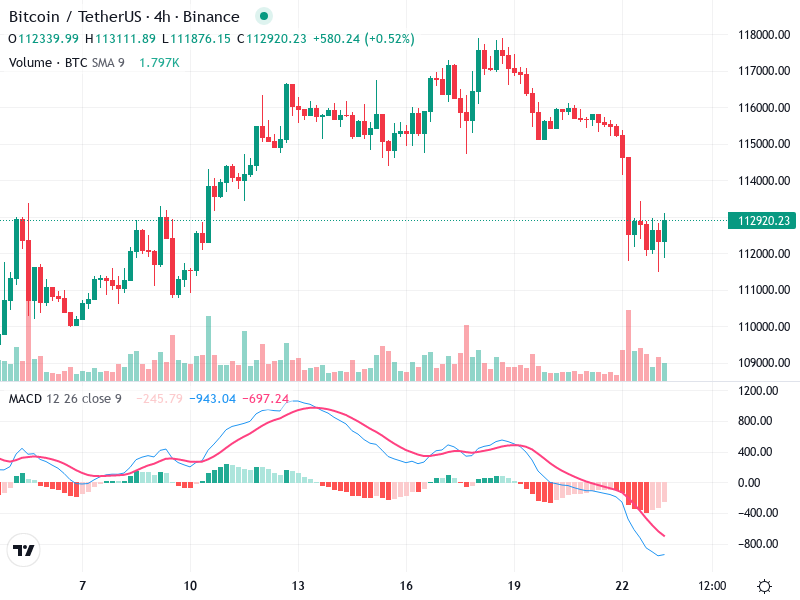
The Bitcoin/TetherUS chart shows a potential for reversal as suggested by the candlestick patterns. The MACD
