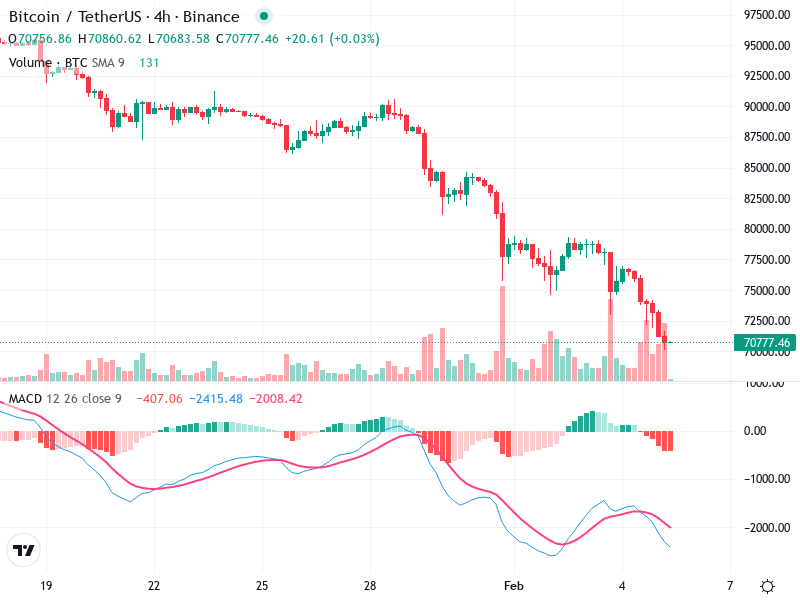
BTC/USD – Technical Analysis – 4h
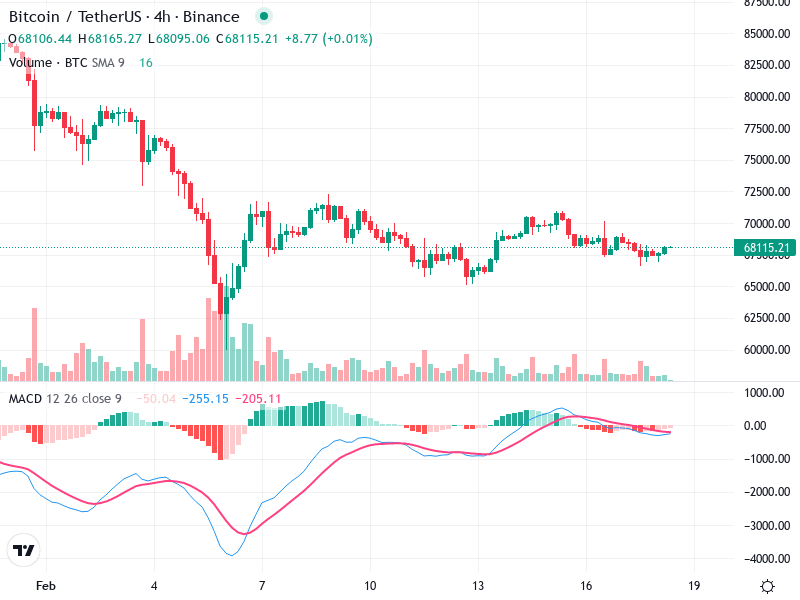
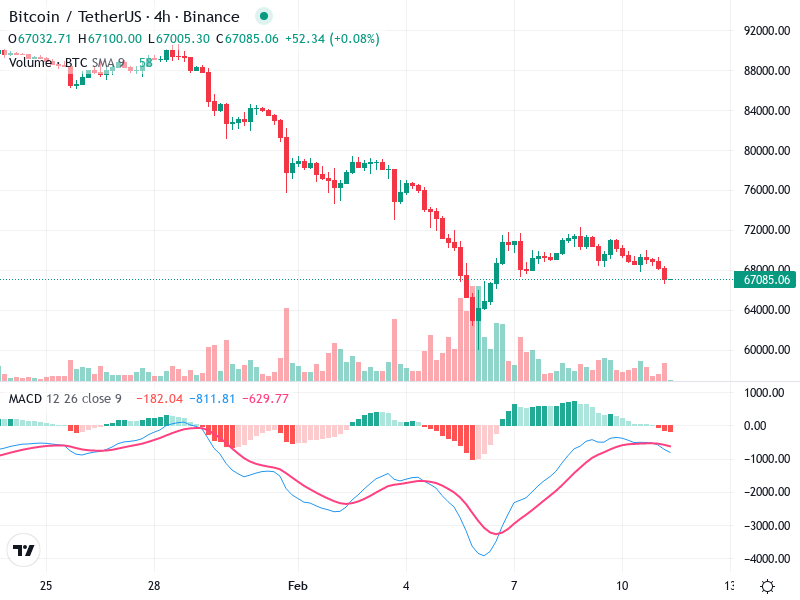
The Bitcoin/TetherUS chart on a 4-hour timeframe shows significant consolidation. The market is in a neutral
The Bitcoin/TetherUS chart on a 4-hour timeframe shows significant consolidation. The market is in a neutral
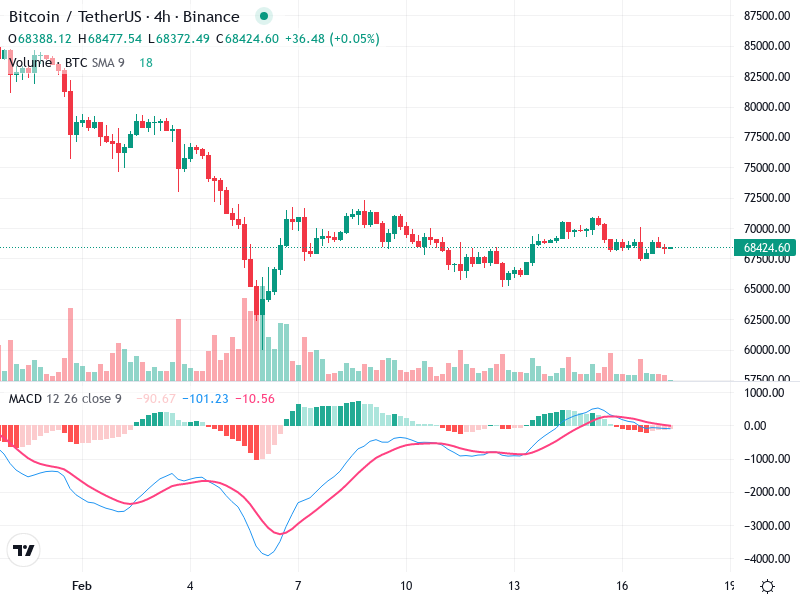
The chart for shows an interesting pattern with recent changes observed in technical indicators. Currently, the
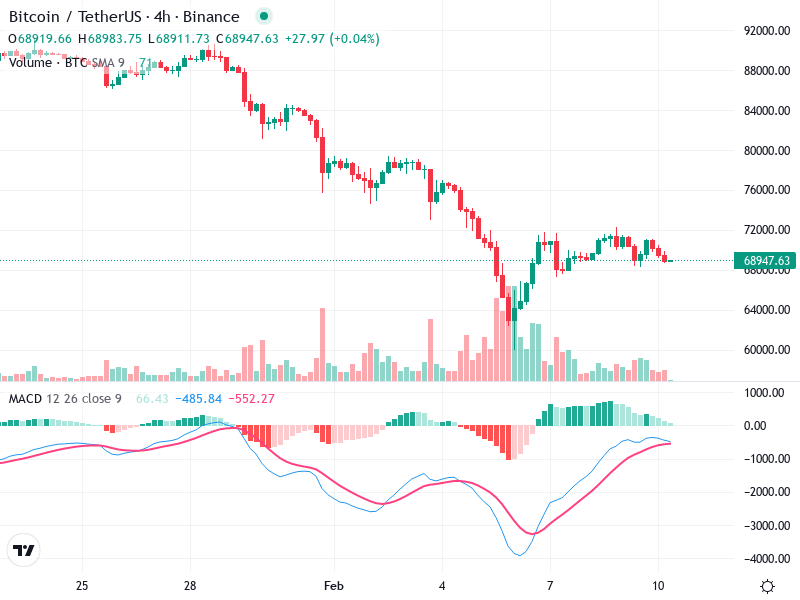
The chart exhibits a bearish trend in late January which transitions into a period of consolidation
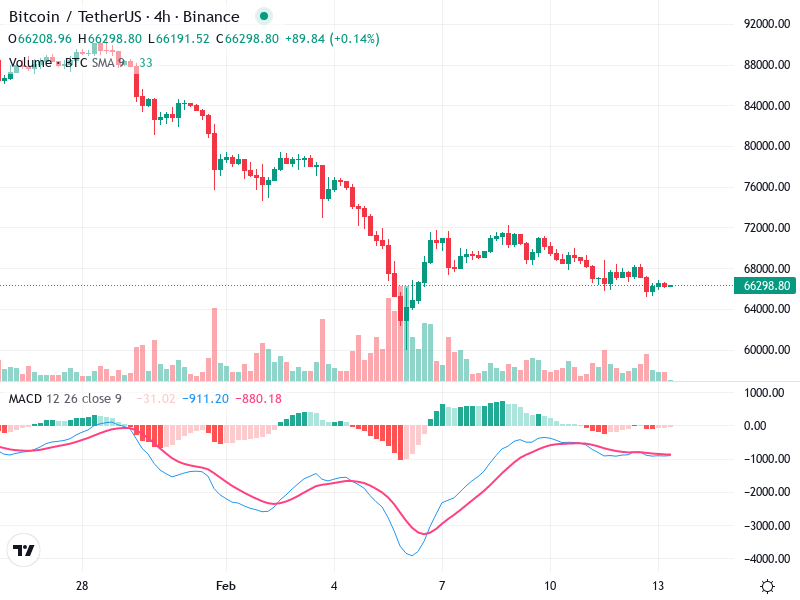
The chart for the asset reflects a complex interaction of market forces. Current sentiment appears to
The analysis of the asset chart indicates a predominantly bearish trend transitioning into sideways movement. Recent
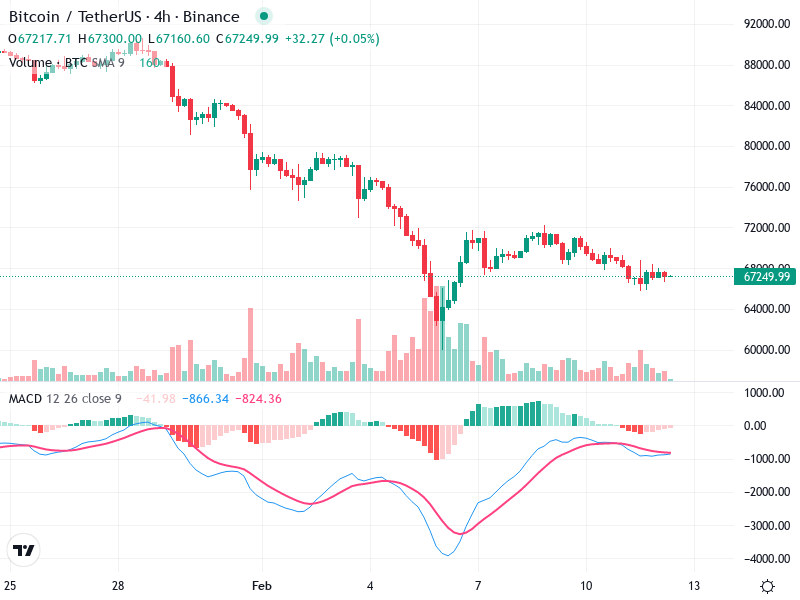
The analysis for reveals several key insights into its chart behavior. The asset appears to be
The chart for shows dynamic movements with potential signals for traders. Recent activity suggests a developing
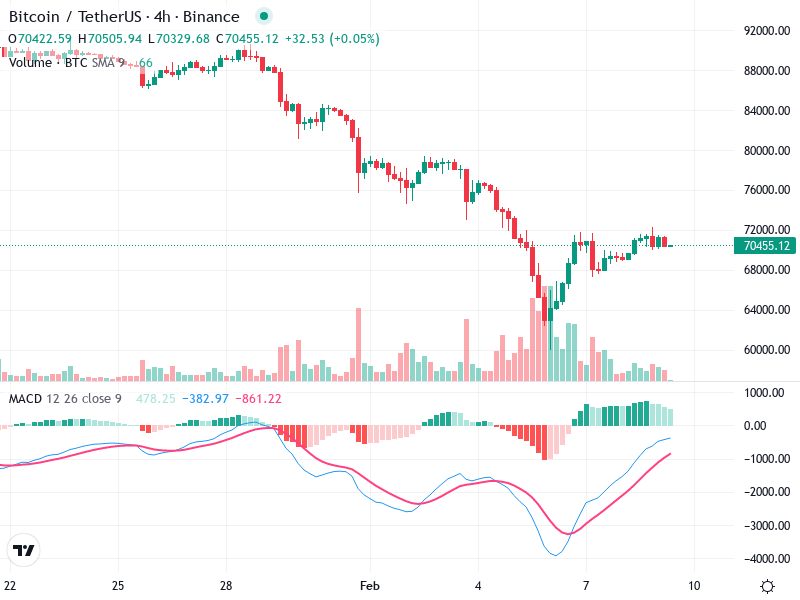
The 4-hour chart for Bitcoin/TetherUS reveals a potential shift in trends, with signs of stabilization after
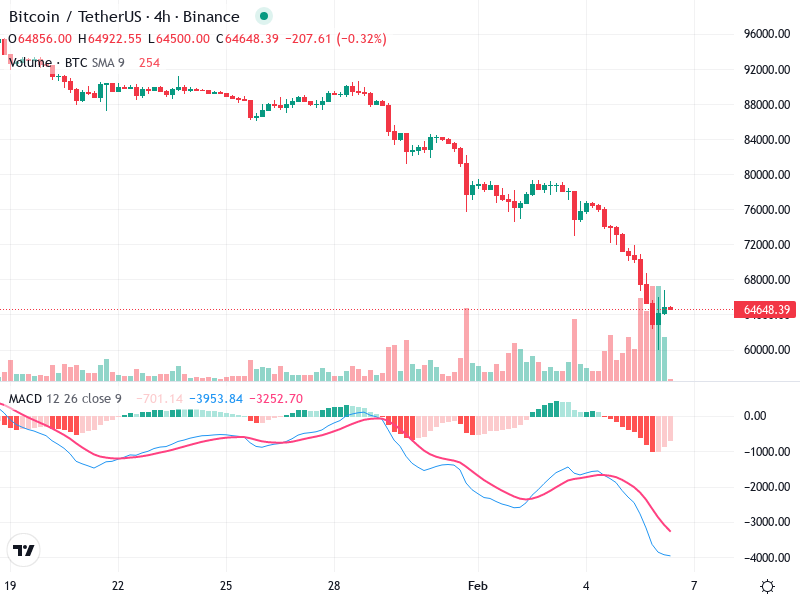
The current analysis highlights a bearish trend for the asset. The chart exhibits several indicators pointing
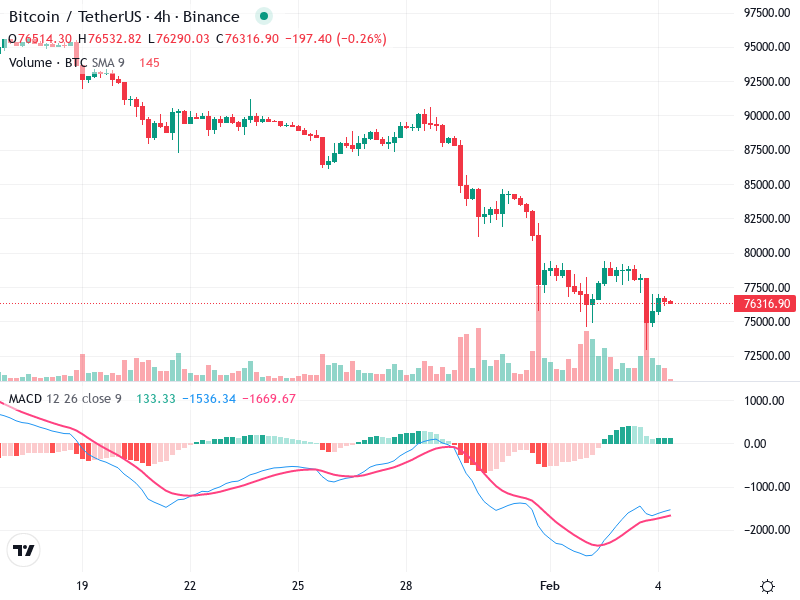
The BTC/USDT chart shows signs of potential trend reversal with key levels to watch. The asset’s
