BTC/USD – Technical Analysis – 4h
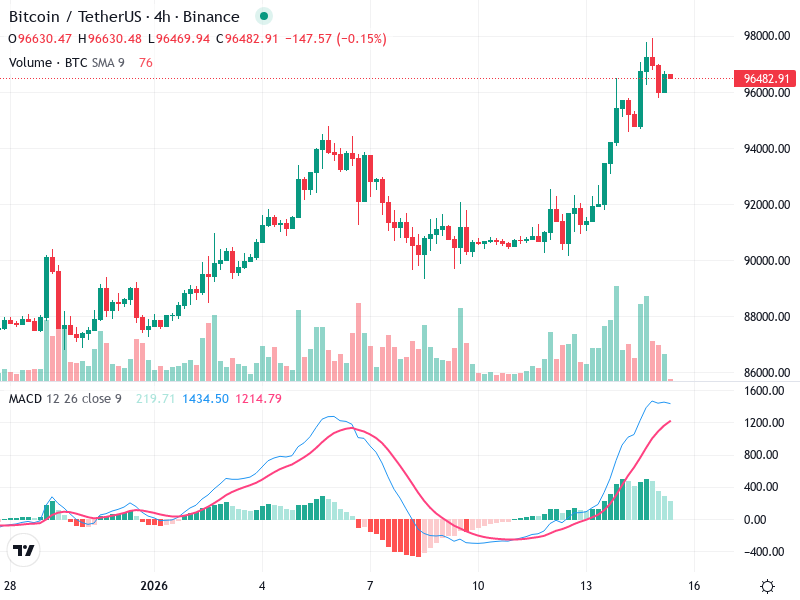
The Bitcoin/TetherUS chart exhibits a strong upward trend from late December to mid-January, characterized by a
The Bitcoin/TetherUS chart exhibits a strong upward trend from late December to mid-January, characterized by a
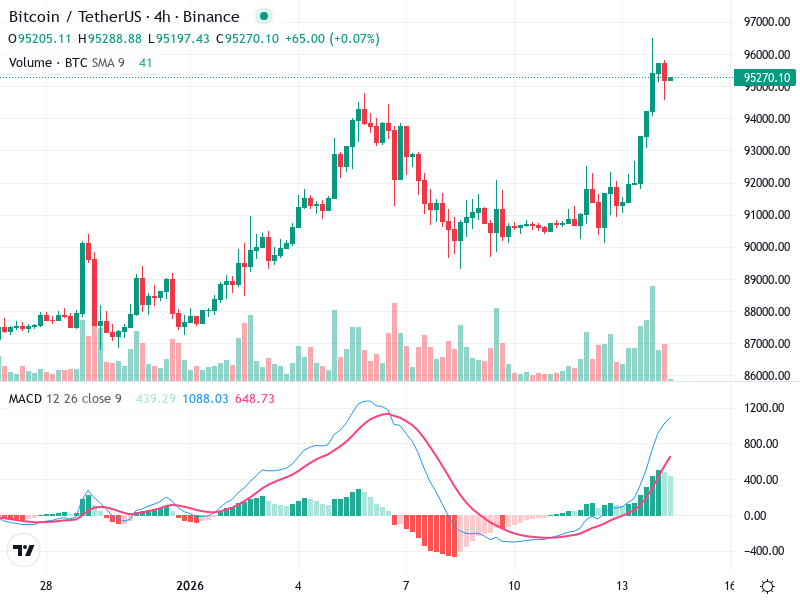
The BTC/USDT chart indicates a bullish trend on the 4-hour timeframe. A strong upward movement is
The analysis of the asset displays interesting patterns that suggest potential upward momentum. The chart transitions
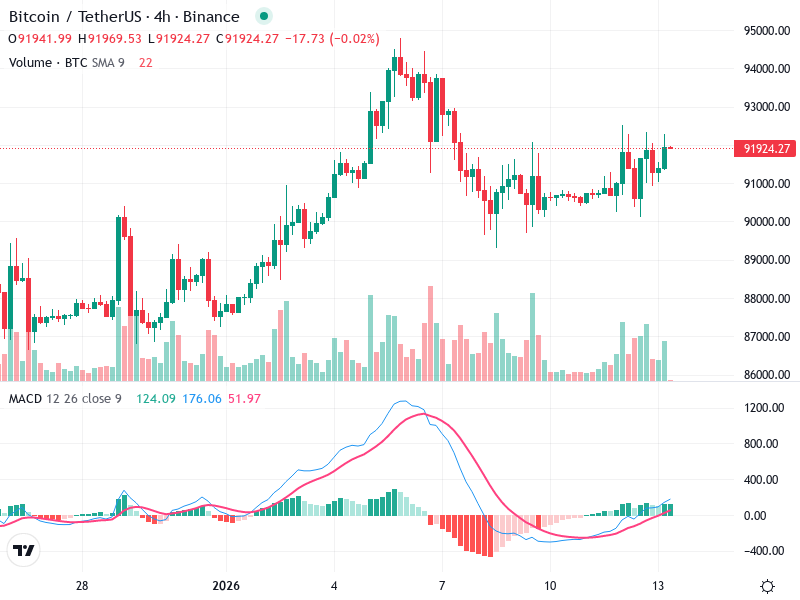
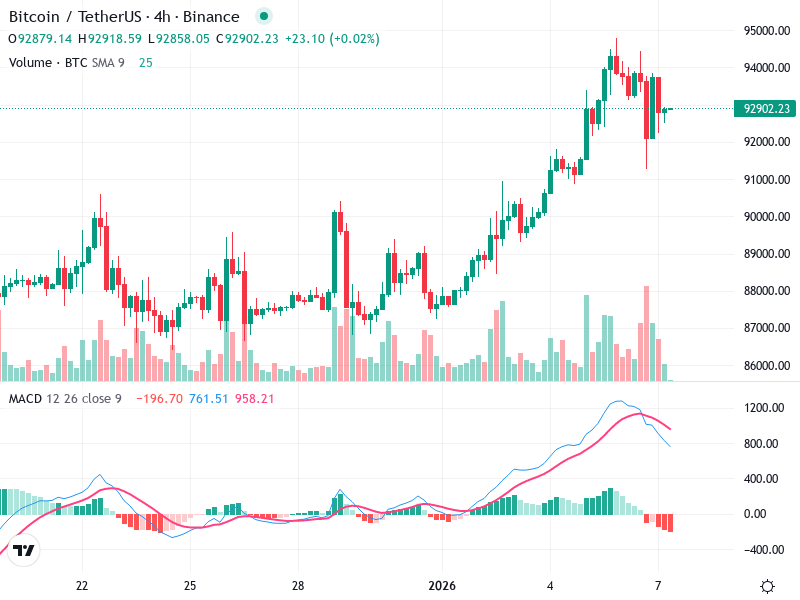
The 4h chart of Bitcoin/TetherUS indicates a potential shift in trend. Bullish signs are emerging with
The chart for Bitcoin/TetherUS reveals critical levels and potential future movements. The asset’s recent price action
This technical analysis focuses on the current market behavior of Bitcoin/TetherUS, examining the latest movements and
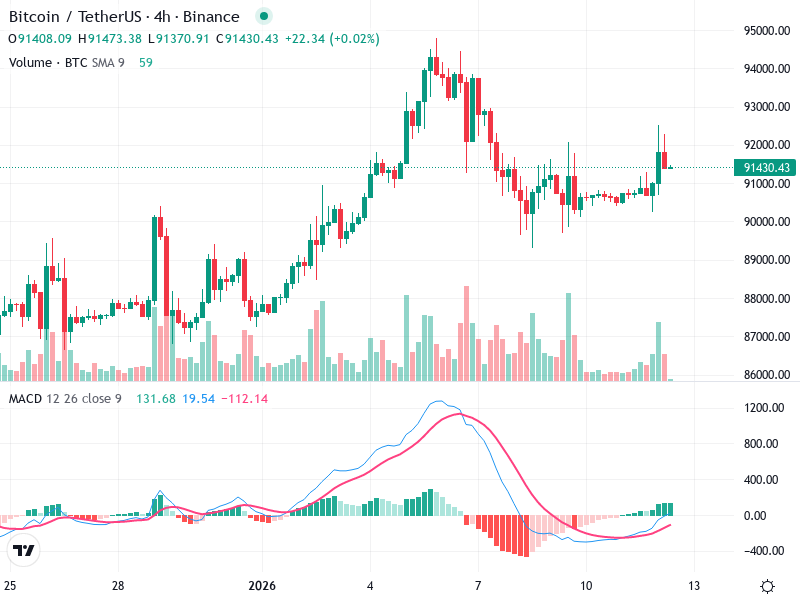
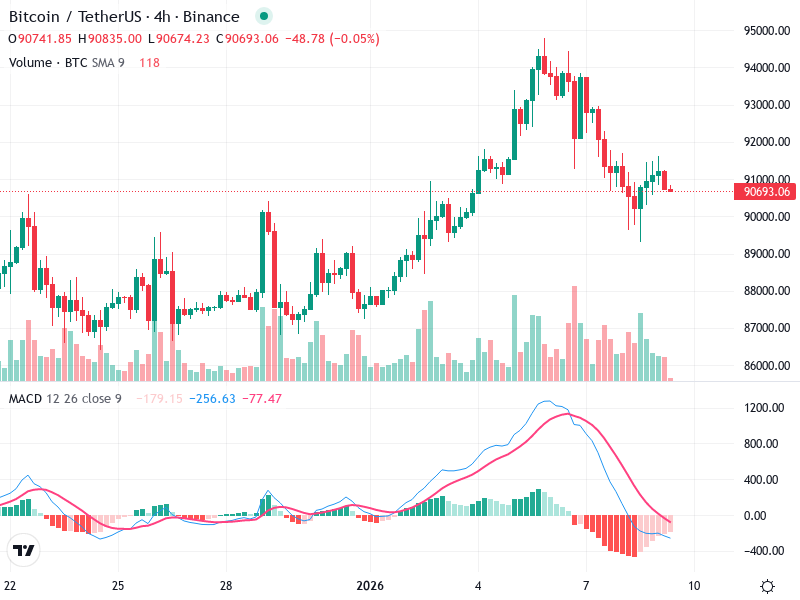
The Bitcoin chart reflects a recent correction following a bullish trend. There is consolidation around key
The chart analysis for Asset shows a significant upward trend, bolstered by recent price movements and
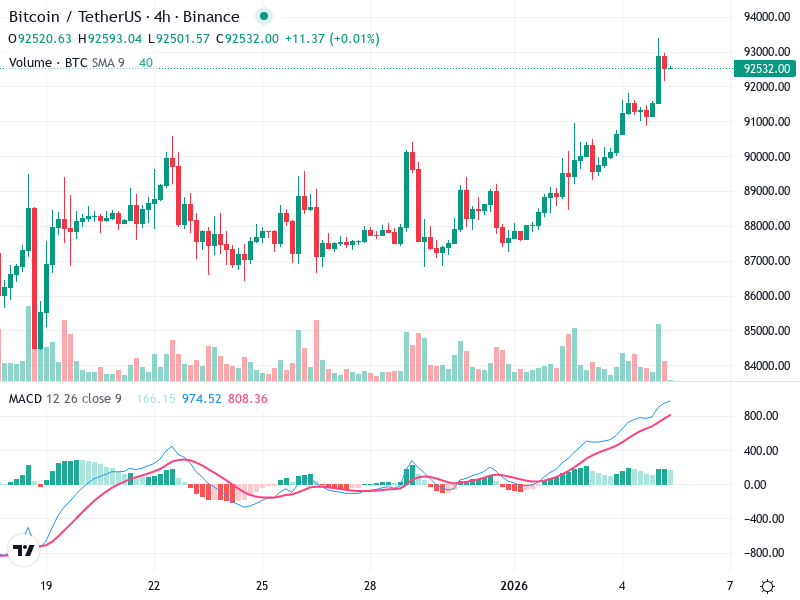
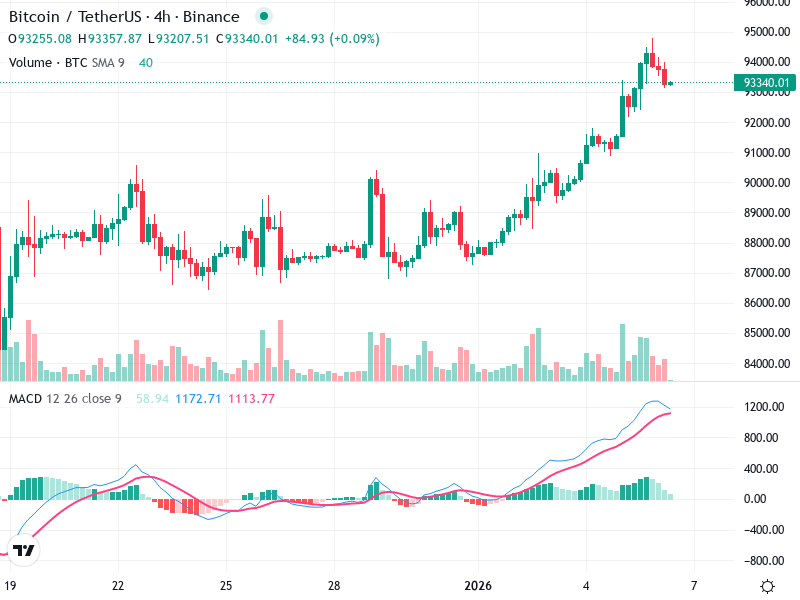
The Bitcoin/TetherUS 4-hour chart exhibits a robust uptrend pattern. With clear bullish signals observed across multiple
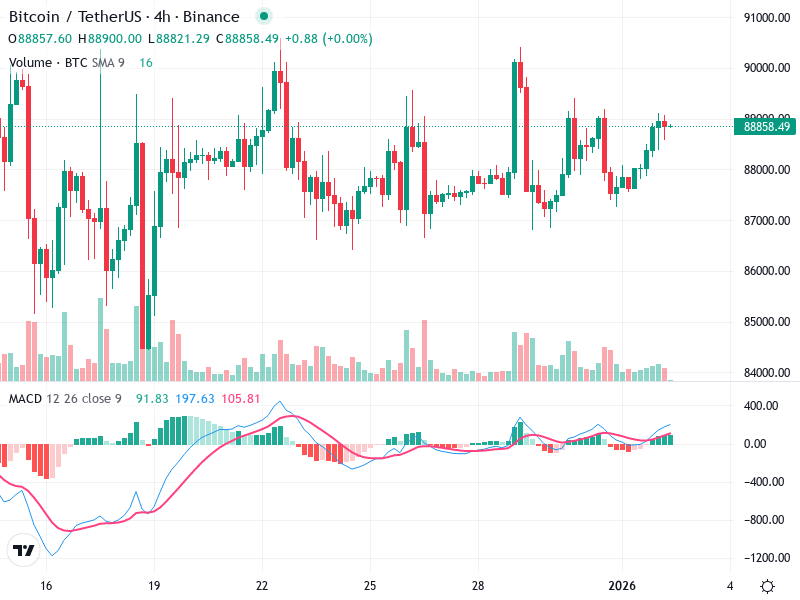
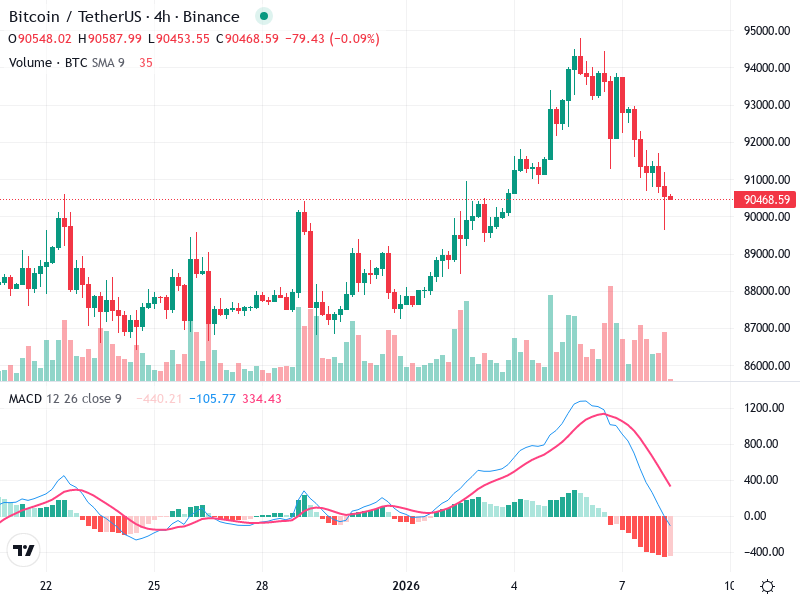
The Bitcoin/TetherUS 4-hour chart currently shows a sideways trend with no clear bullish or bearish dominance.

