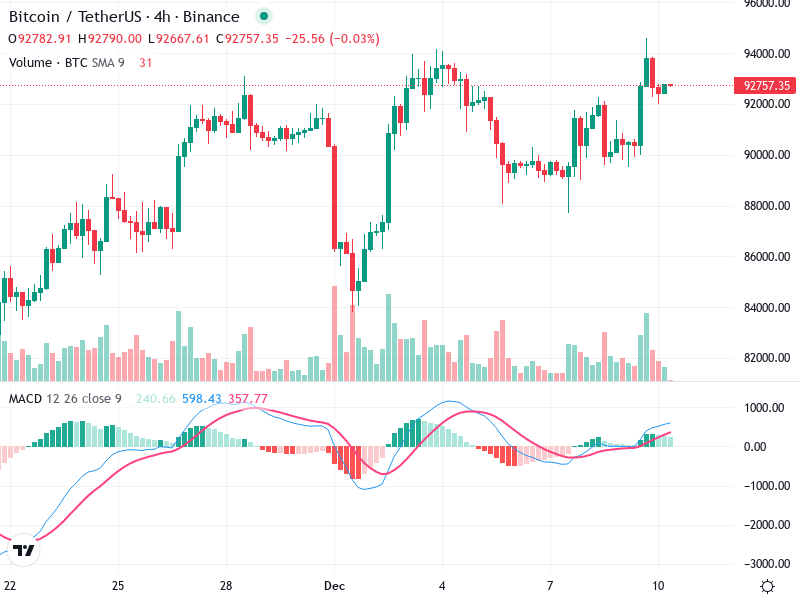
BTC/USD – Technical Analysis – 4h
The 4-hour chart for Bitcoin/TetherUS shows recent trends and potential reversal signals. With important technical indicators
The 4-hour chart for Bitcoin/TetherUS shows recent trends and potential reversal signals. With important technical indicators
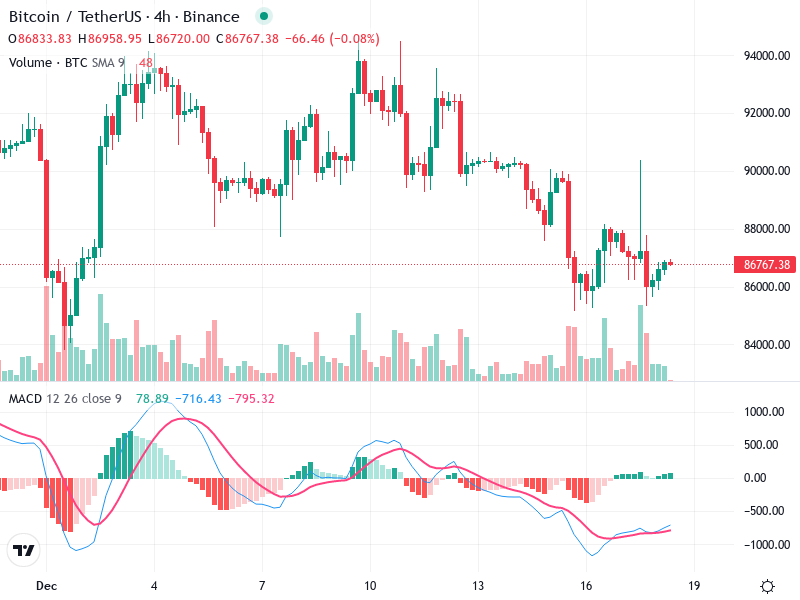
The asset’s chart reflects recent bearish trends. The established lower highs and lower lows imply a

The chart reveals a significant moment of analysis with current trends and patterns. Observations include key
The Bitcoin/TetherUS 4-hour chart reveals a potential shift in momentum as notable patterns emerge. The asset
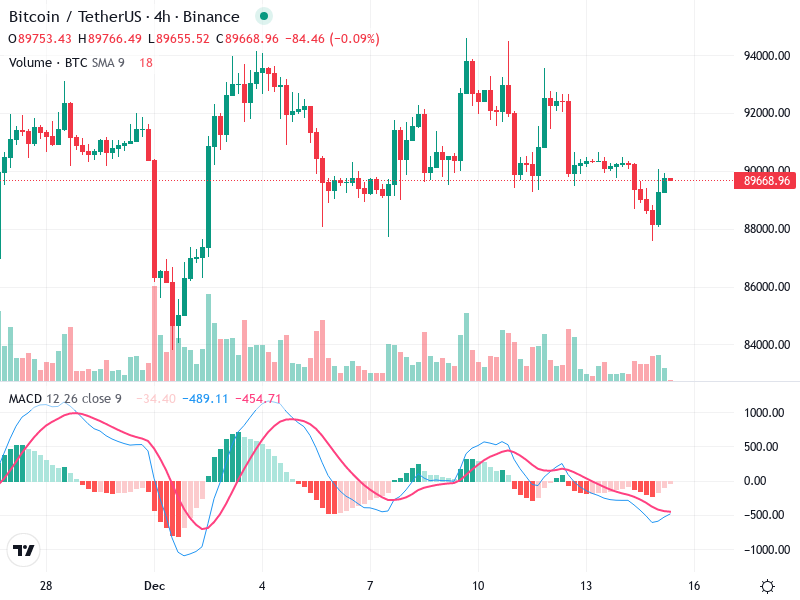
The asset’s chart predominantly shows a sideways trend, with recent movements indicating a bearish tendency marked
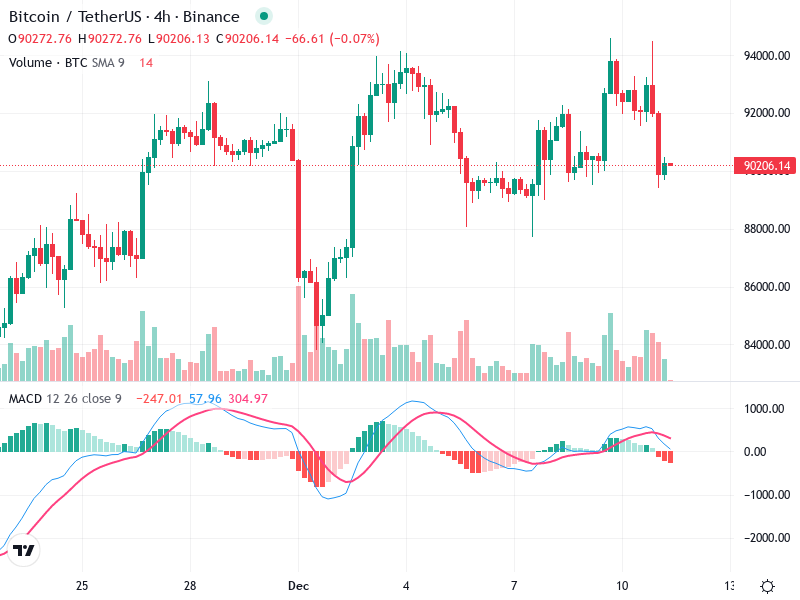
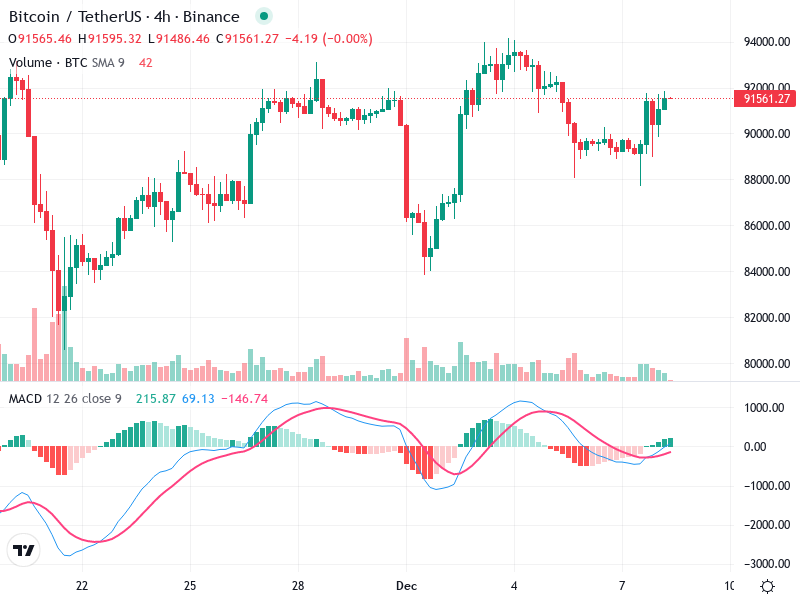
The chart reveals a predominantly sideways trend with underlying bullish potential. seems to be oscillating within
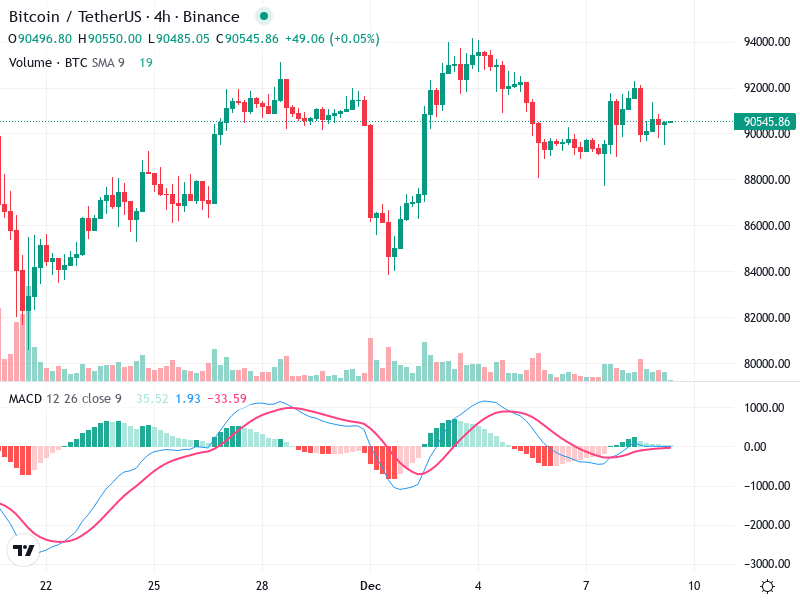
The 4-hour chart of Bitcoin/TetherUS reveals a largely sideways movement with occasional bullish and bearish swings.
The chart highlights significant movements for the asset. Recent trends suggest a notable shift in sentiment.
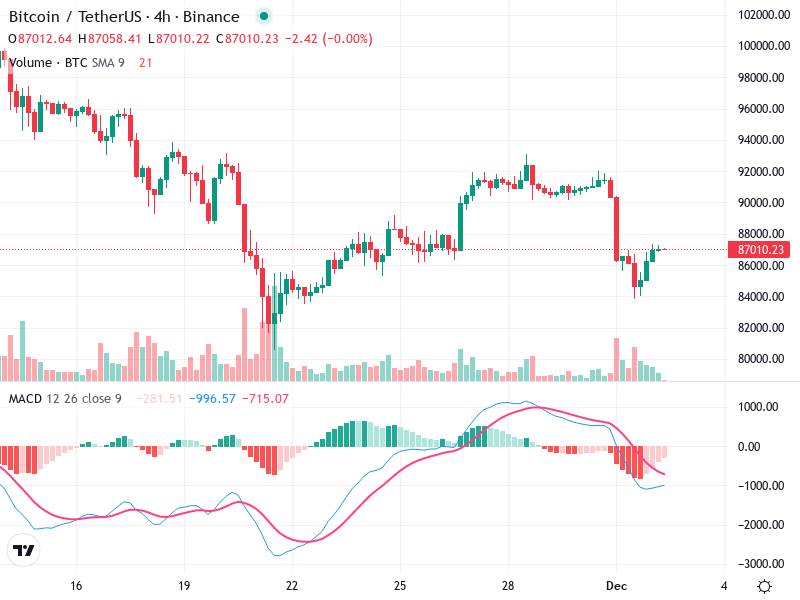
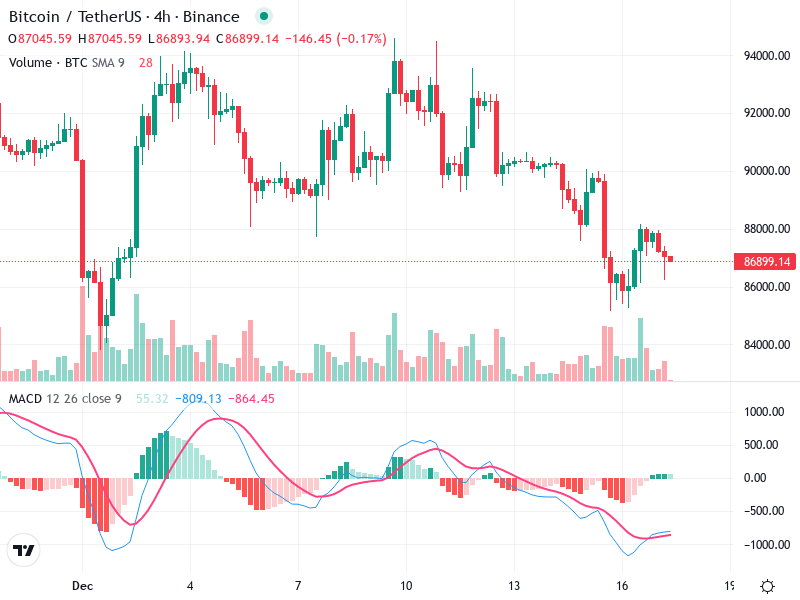
The market asset recently displayed strong bearish indicators, with significant sell-offs. However, there are initial signs
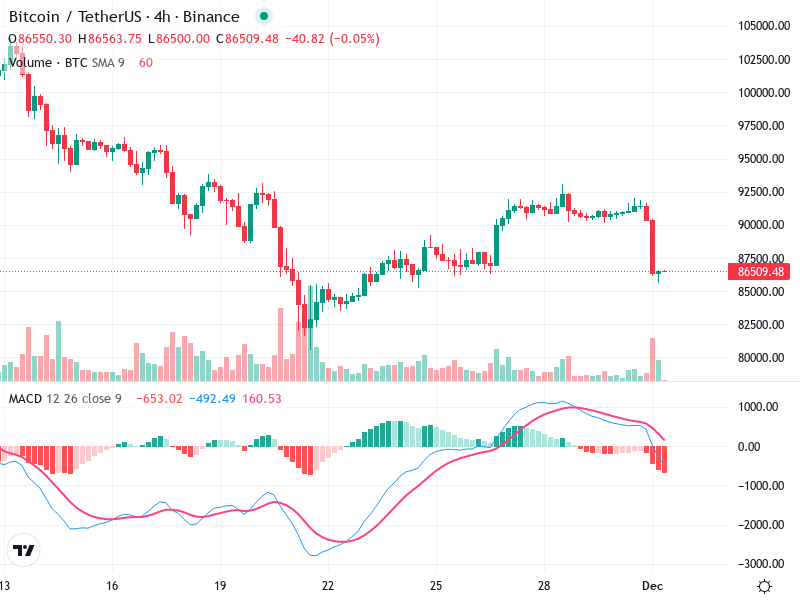
The chart shows a pronounced decline, with significant bearish indicators. The market sentiment suggests a cautious
