BTC/USD – Technical Analysis – 4h
The chart exhibits a period of consolidation, with prices oscillating within a defined range. Despite this
The chart exhibits a period of consolidation, with prices oscillating within a defined range. Despite this
The chart illustrates the ongoing market dynamics of , highlighting the interaction between price action and
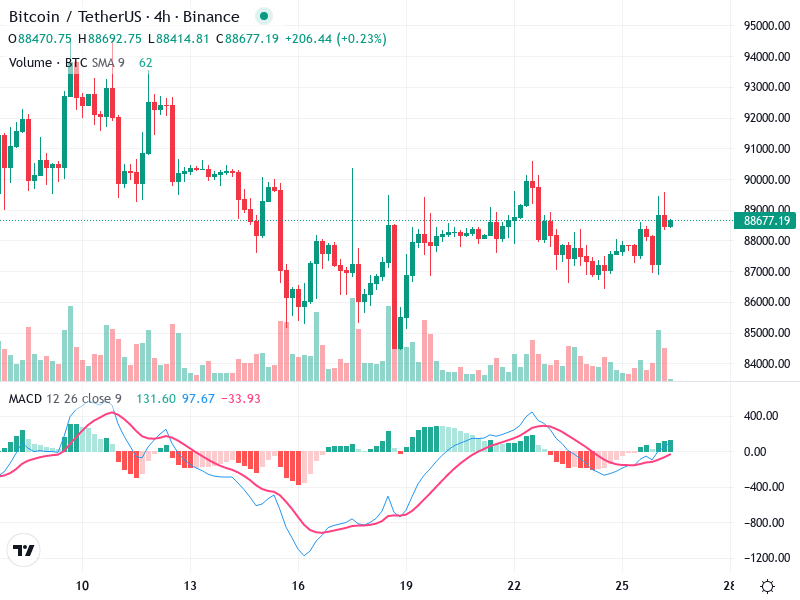
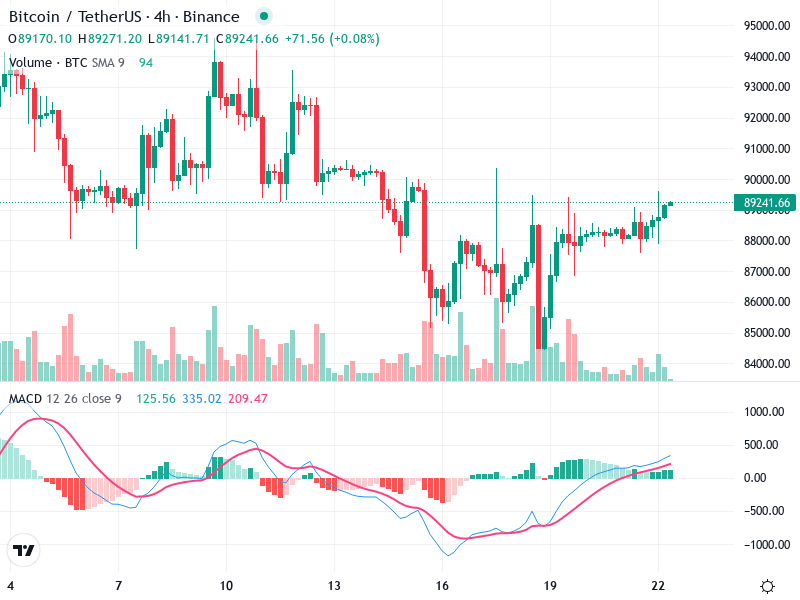
The 4-hour chart of Bitcoin against TetherUS shows recent price action characterized by resistance at the
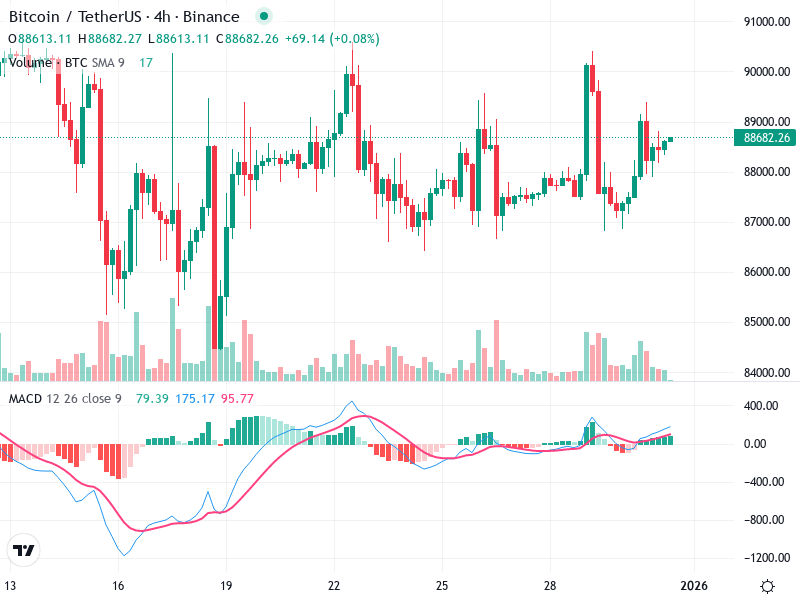
The Bitcoin/TetherUS 4-hour chart reveals potential bullish momentum emerging. Recent candlestick patterns indicate a possible breakout,

This chart provides a comprehensive overview of the asset’s recent market behavior. The sideways movement in
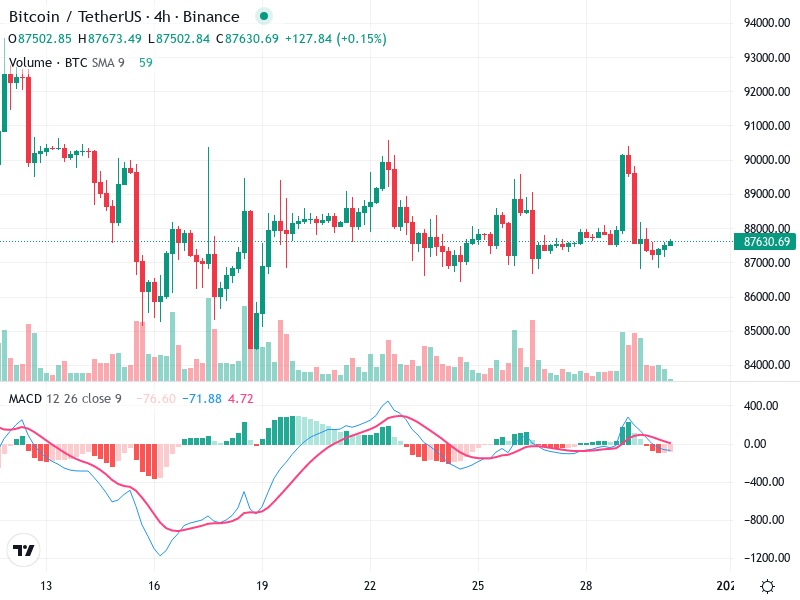
The asset’s chart demonstrates a period of consolidation with no distinct trend driving the price movement.
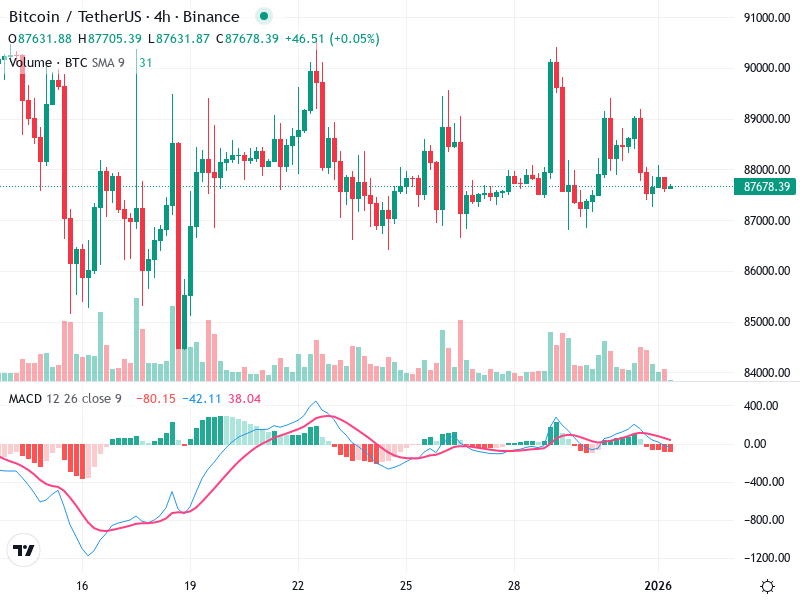
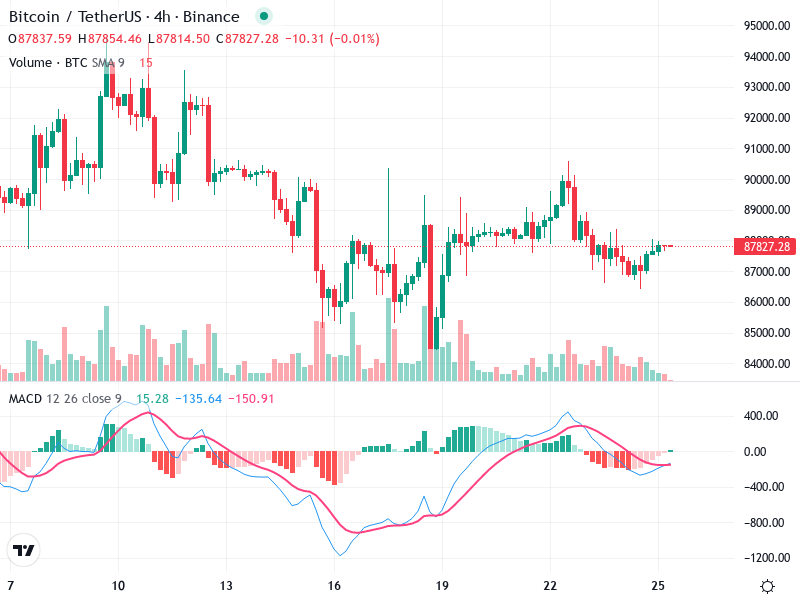
The asset’s chart currently exhibits a sideways trend with slight bearish tendencies. Recent technical indicators suggest
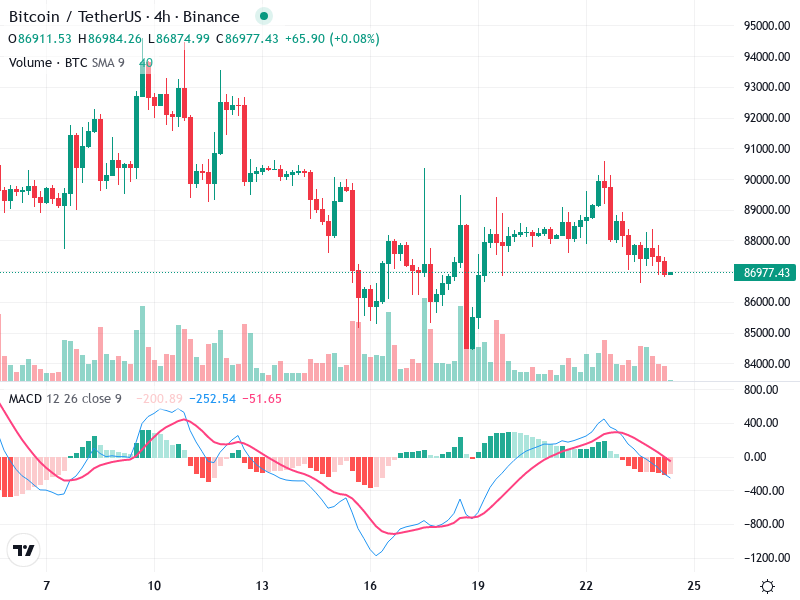
The chart for the asset reveals significant bearish sentiment. Recent candlestick patterns and volume signal a
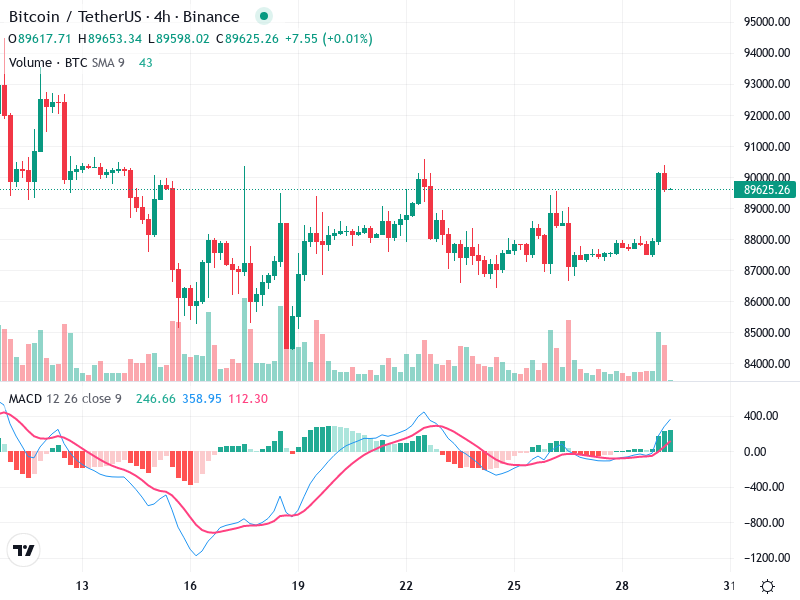
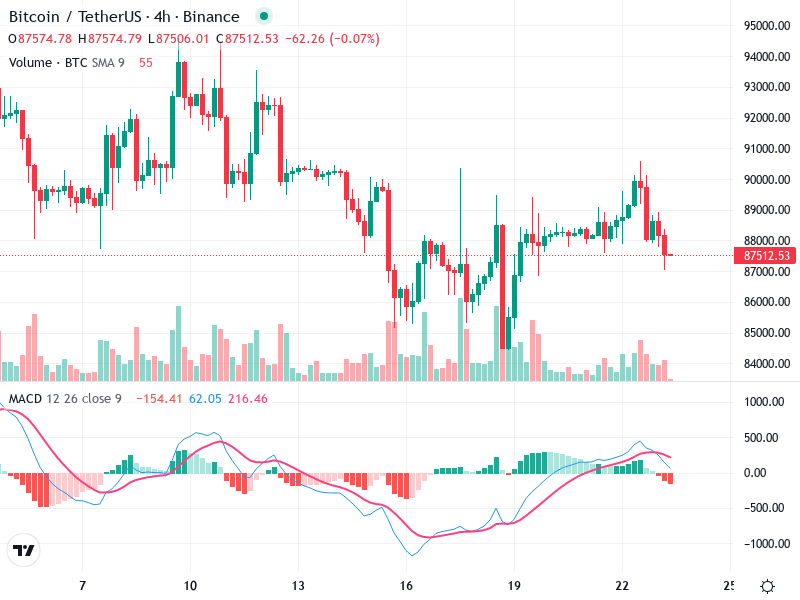
The asset’s chart indicates a recovery from a downtrend. Recent bullish patterns suggest a positive outlook.
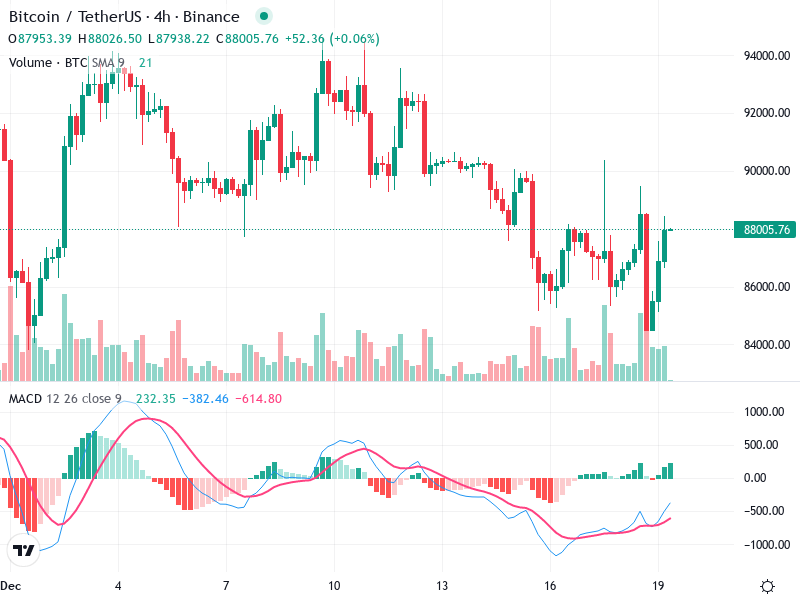
The Bitcoin / TetherUS chart displays a sideways trend with price volatility. A potential bullish engulfing
