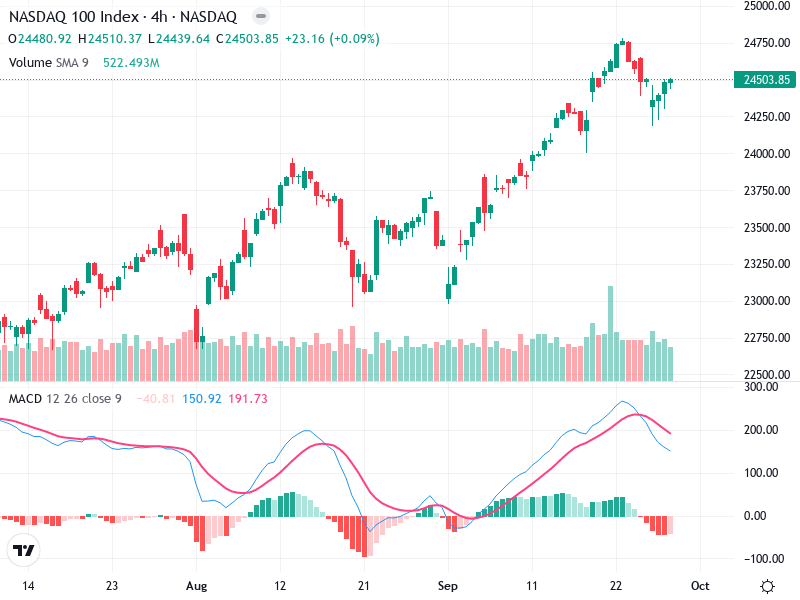
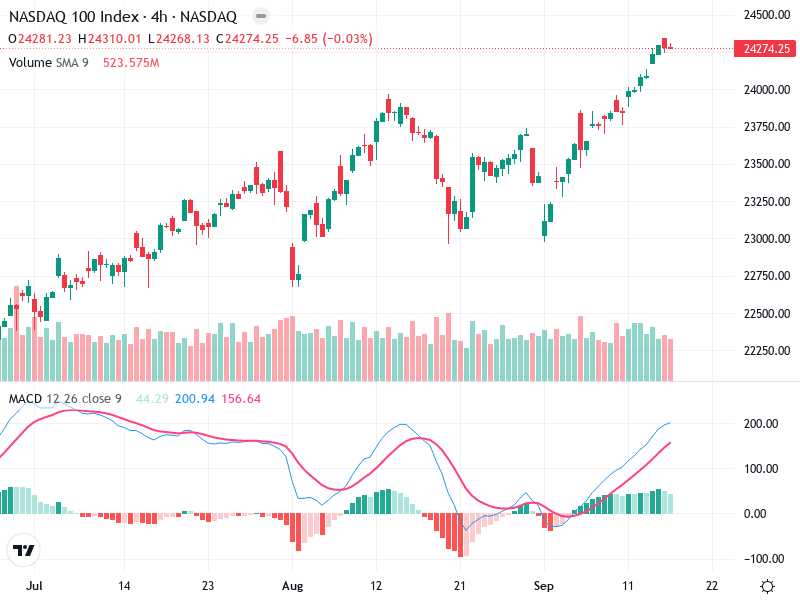
NSDQ – Technical Analysis – 4h
The recent chart depicts an interesting trend for the asset, showing potential signs of both caution
The recent chart depicts an interesting trend for the asset, showing potential signs of both caution
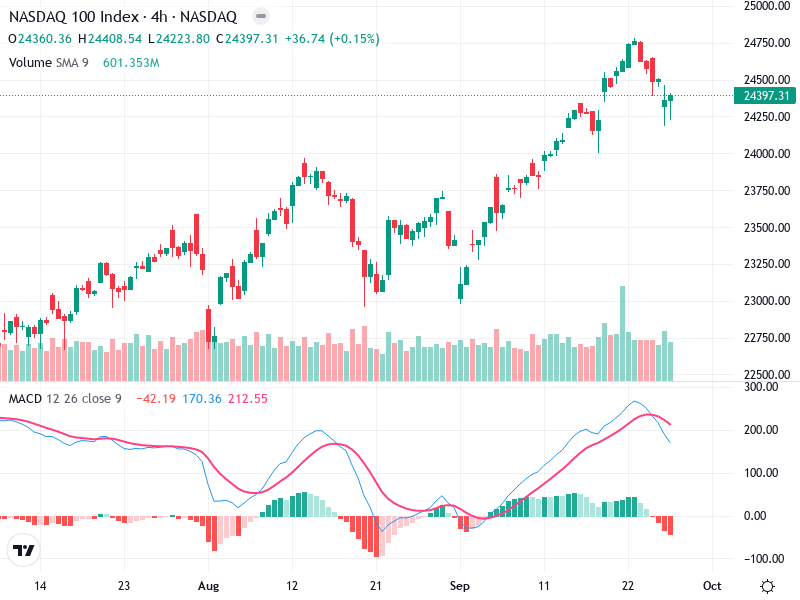
The recent analysis of shows interesting patterns in various technical indicators. The chart suggests a pivotal

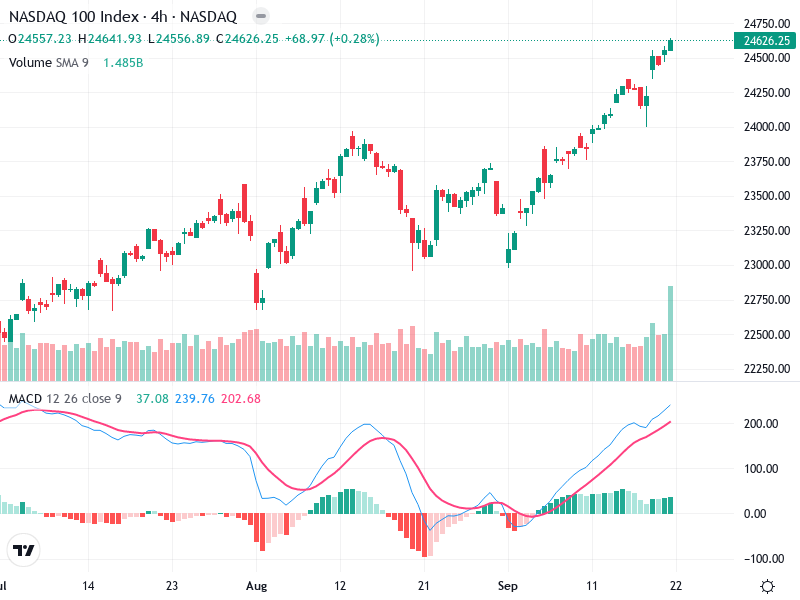
The NASDAQ 100 Index has been displaying a robust bullish trend with consistent higher highs and
The asset exhibits a strong uptrend on the chart with recent highs pointing to bullish sentiment.
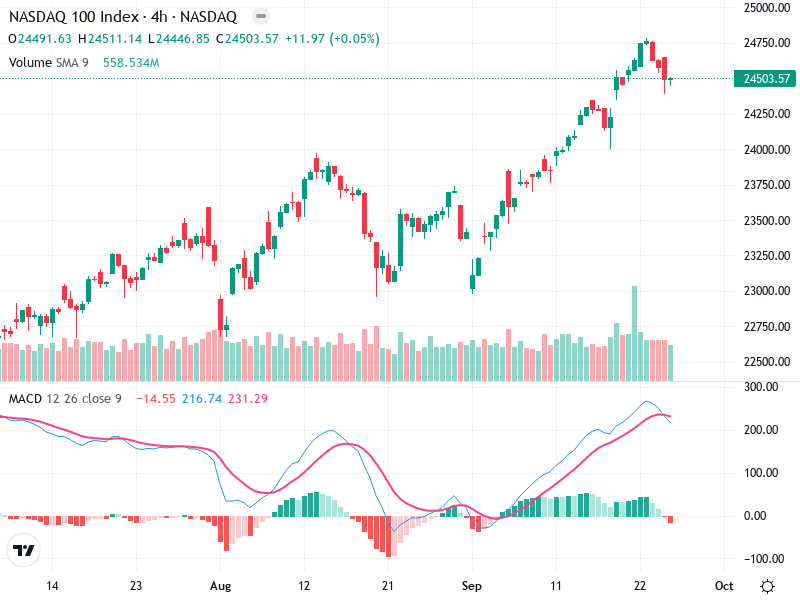
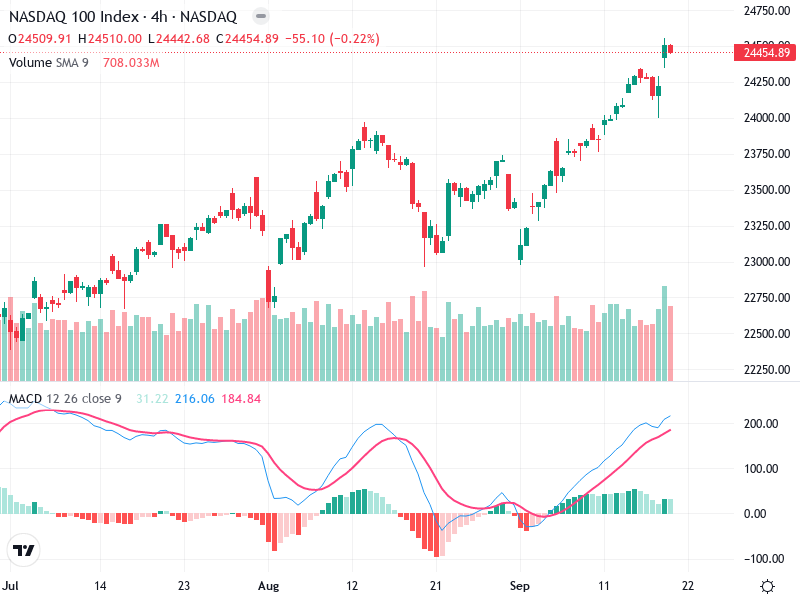
The NASDAQ 100 Index chart shows a strong upward trend, supported by various technical indicators. The
The chart for reveals a robust uptrend, supported by technical indicators. Recent price movements suggest strong
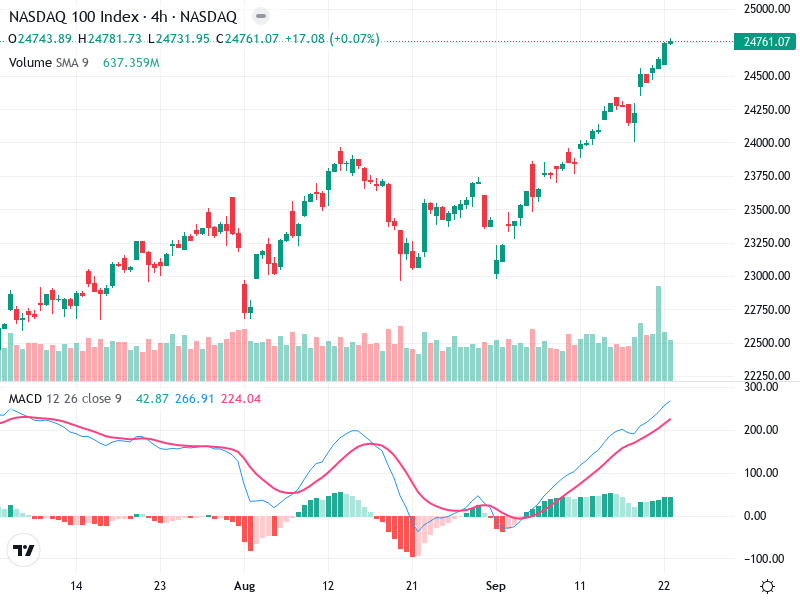
The NASDAQ 100 Index chart on the 4-hour timeframe suggests a strong bullish trend from mid-August
The asset is showing a strong bullish trend with higher highs and higher lows. The current
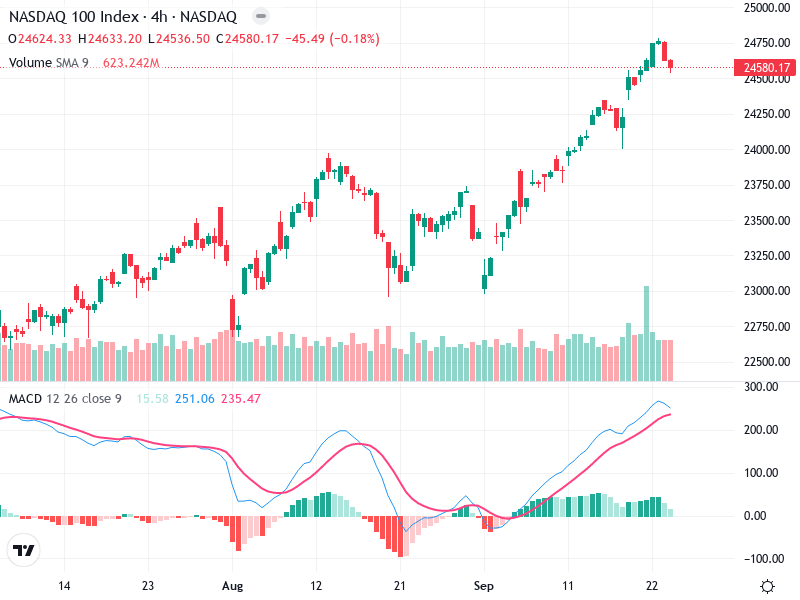
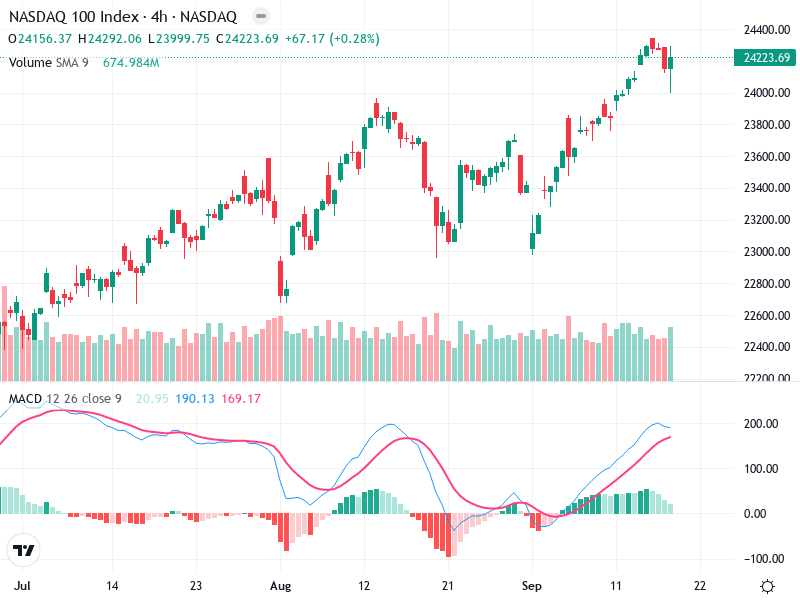
The NASDAQ 100 demonstrates notable upward movement, evidenced by recent bullish trends. This index has shown
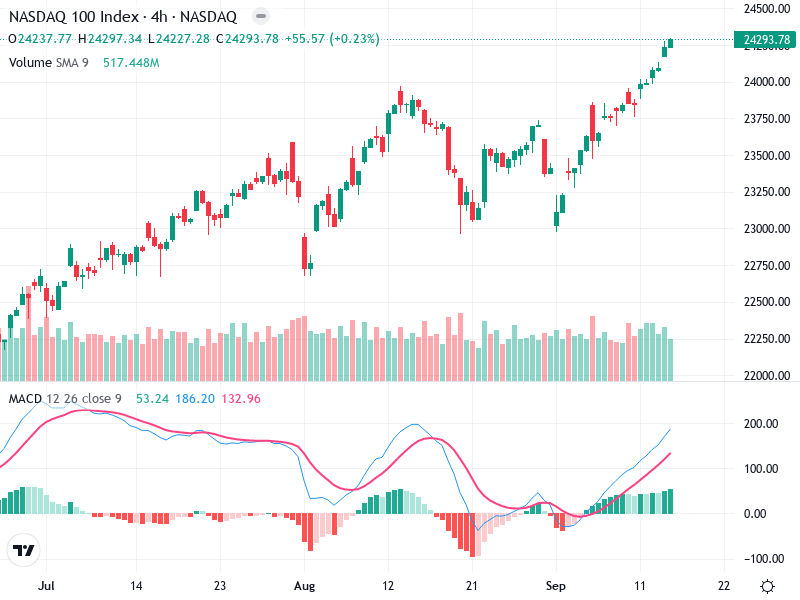
This asset displays strong upward momentum as seen in the technical indicators. The recent price action
