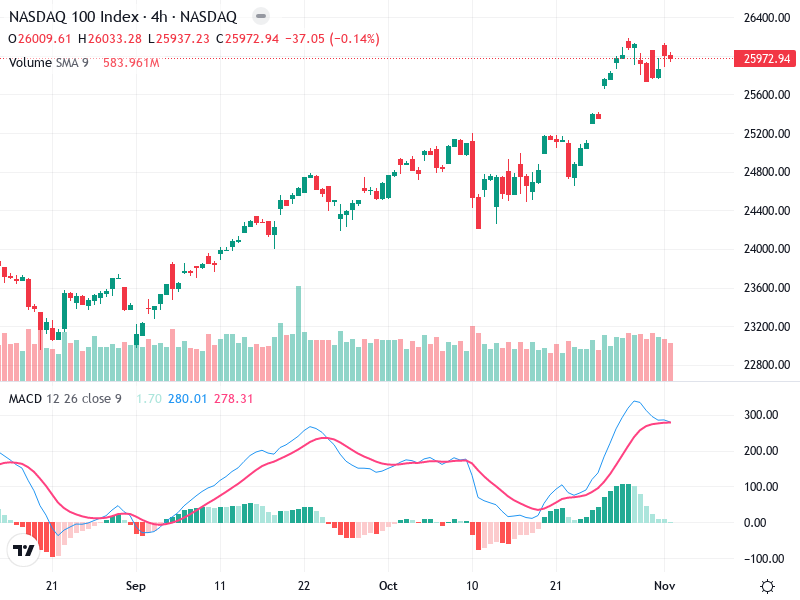
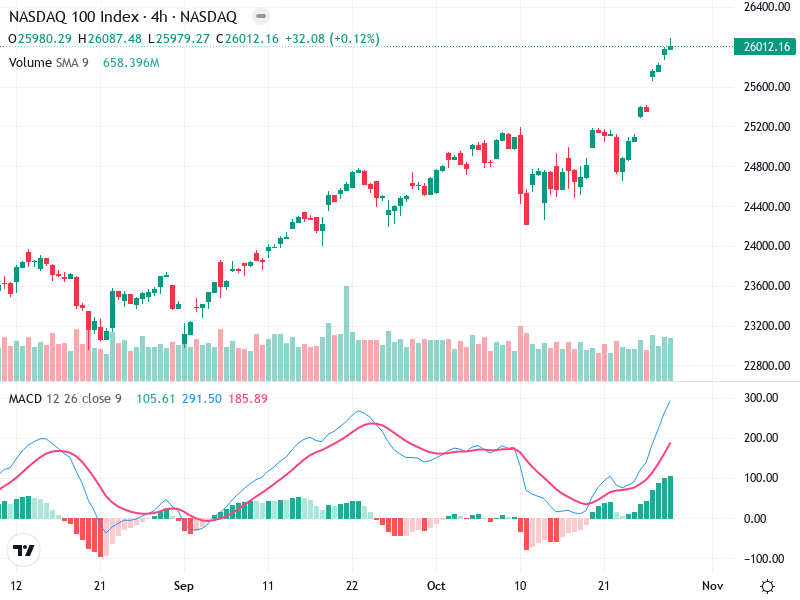
NSDQ – Technical Analysis – 4h
The NASDAQ 100 Index is currently showing signs of a bullish trend with potential for continuation.
The NASDAQ 100 Index is currently showing signs of a bullish trend with potential for continuation.
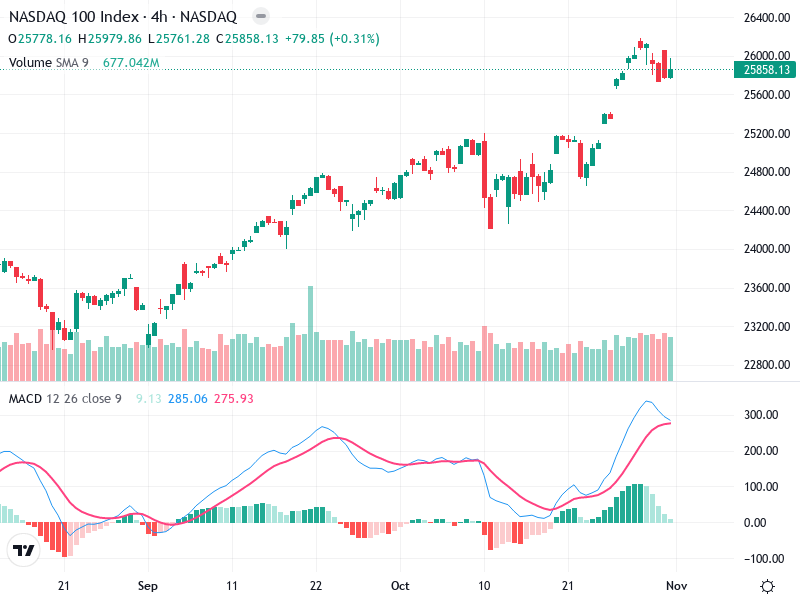
The NASDAQ 100 index has shown a strong bullish trend recently, breaking above key resistance levels.
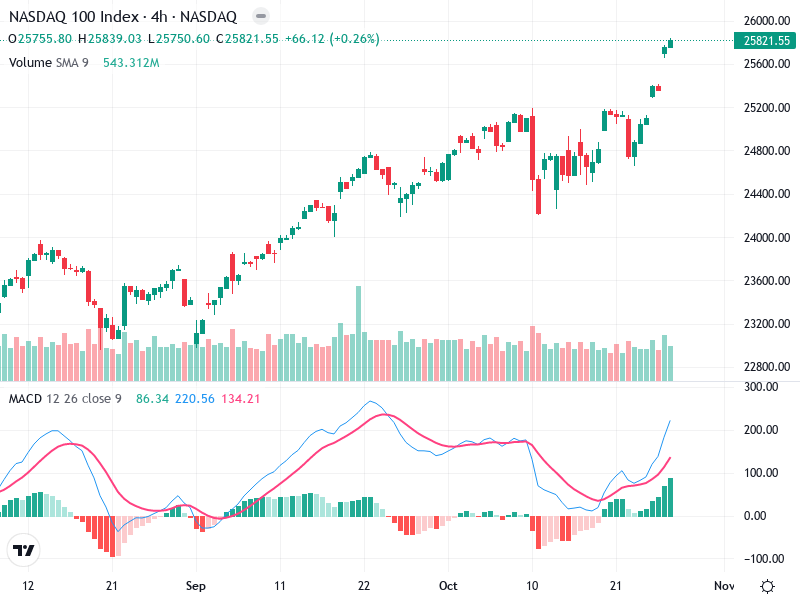
The chart analysis for the asset offers insights into current market dynamics. Observations indicate critical levels
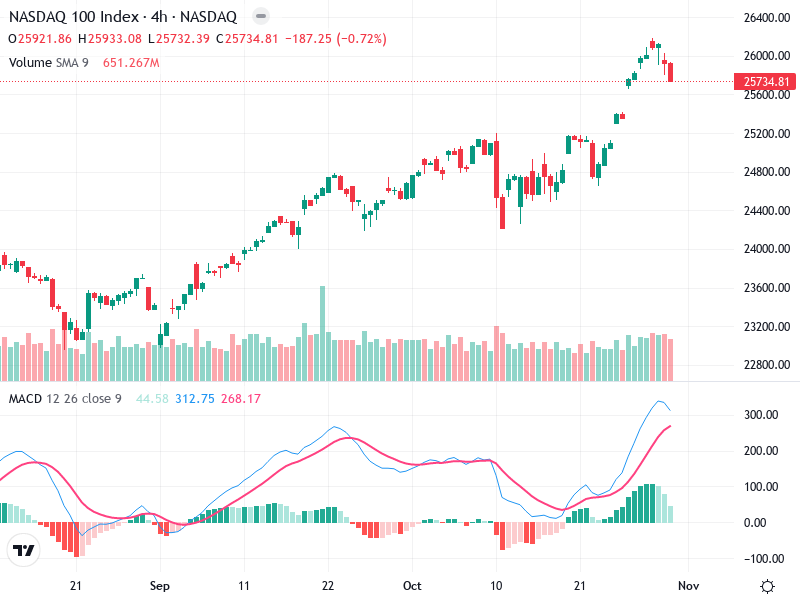
The NASDAQ 100 Index presents a robust bullish setup, driven by consistent upward movements in the
The chart of shows a strong uptrend. Recent price movements indicate a bullish outlook. The asset
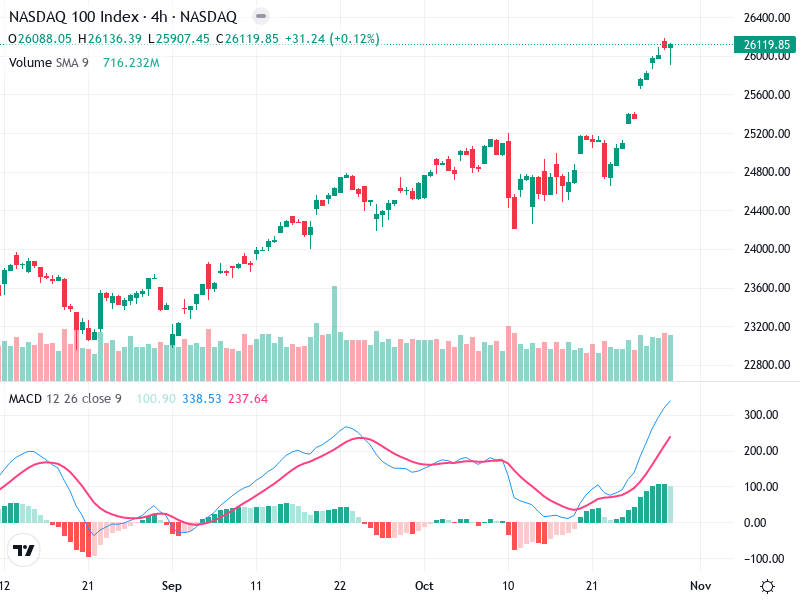
The NASDAQ 100 Index is showing strong bullish signals. Recent technical indicators suggest continued upward momentum.
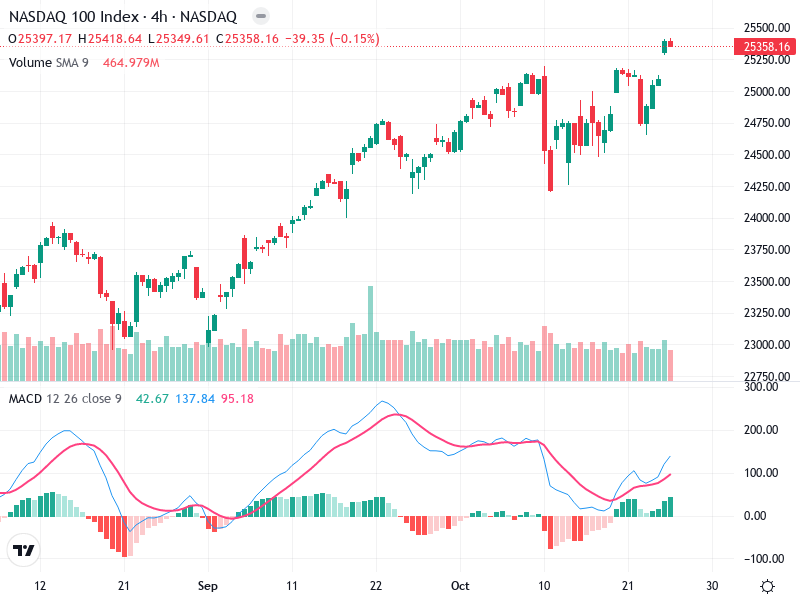
This chart demonstrates the technical aspects of the asset’s recent performance. Observations suggest a clear trend
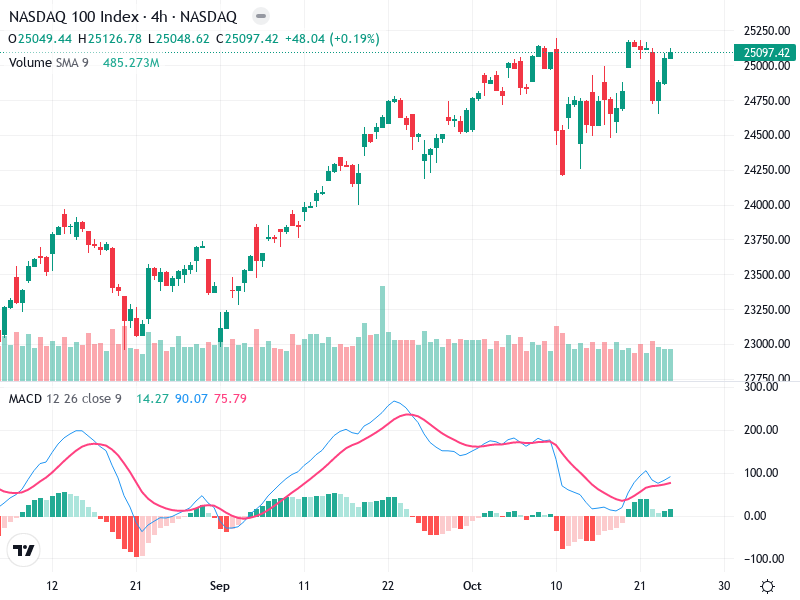
The NASDAQ 100 Index chart shows a strong bullish trend, with higher highs and higher lows.
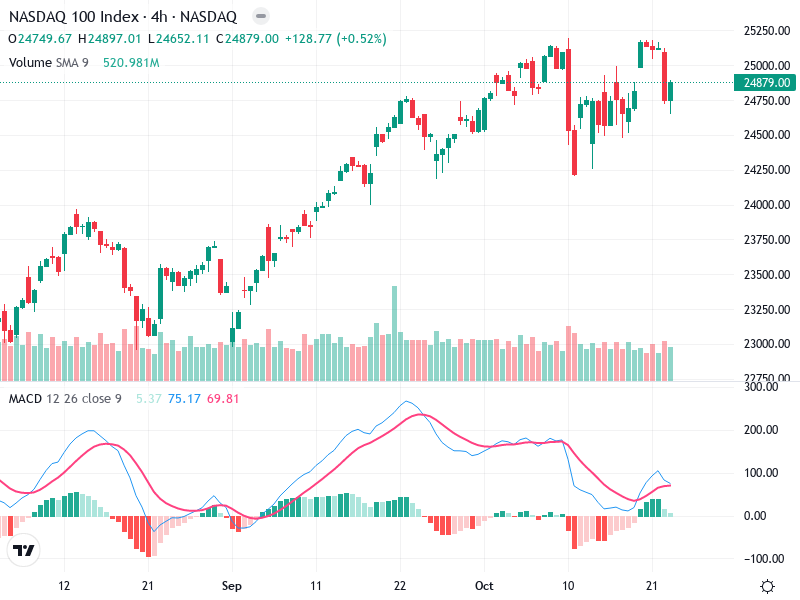
The NASDAQ 100 Index is analyzed on a 4-hour chart, showing significant movements over the past
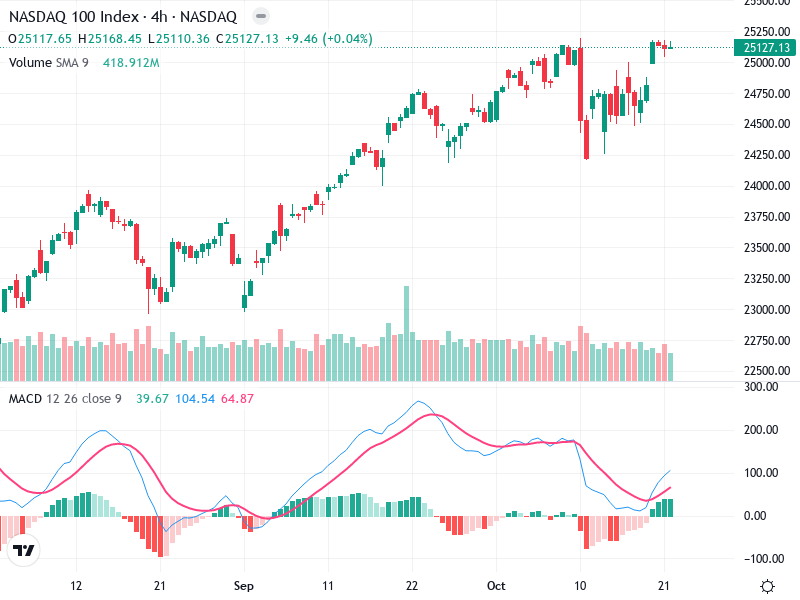
The NASDAQ 100 Index 4h chart displays key insights for traders. It highlights technical indicators that
