
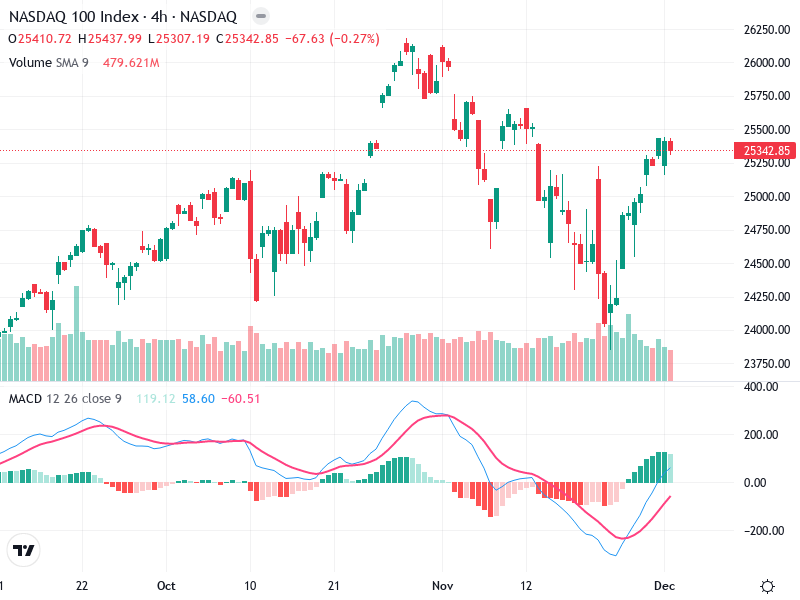
NSDQ – Technical Analysis – 4h
The chart presents a clear bullish trend for the asset, characterized by strong green candlesticks and
The chart presents a clear bullish trend for the asset, characterized by strong green candlesticks and
The analysis of shows a potential shift in trends with significant indicators pointing towards a bullish
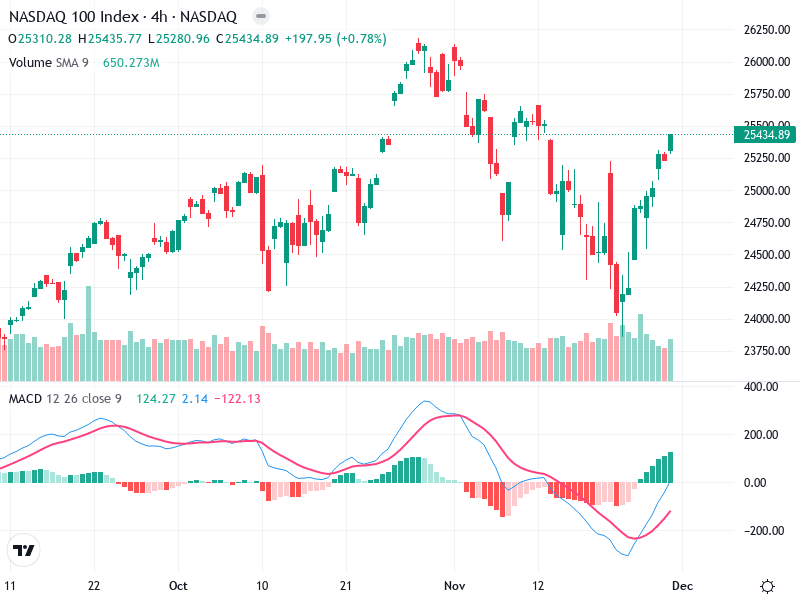
The chart of reveals a developing bullish trend, supported by consistent buying pressure. There is an


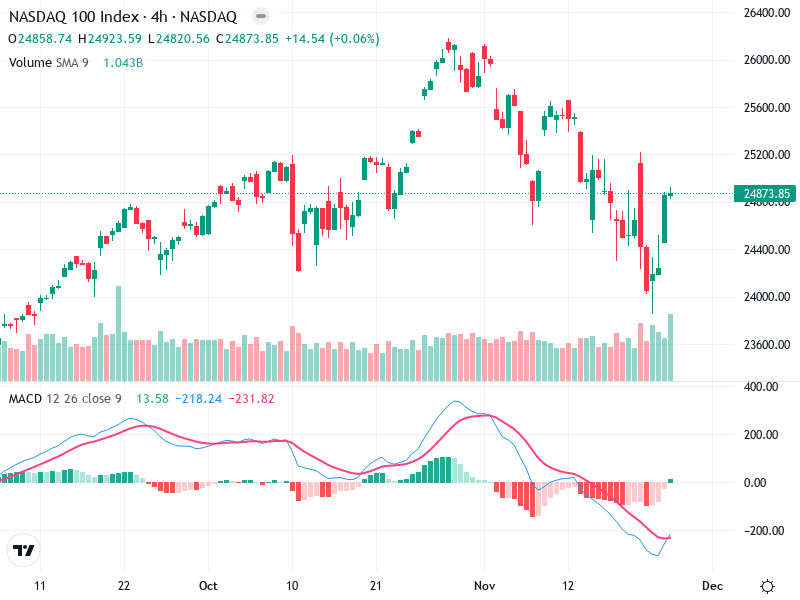
The NASDAQ 100 chart shows a recovery from its recent downtrend. Key indicators suggest a potential
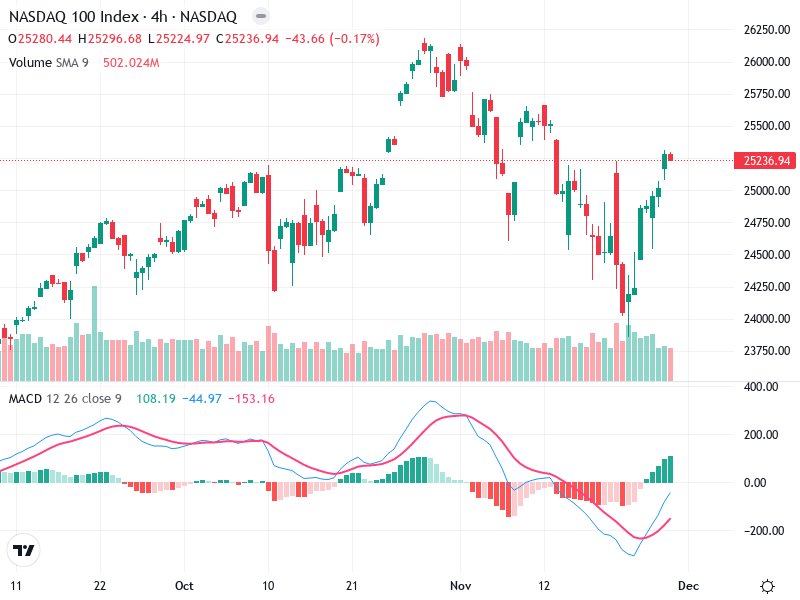
The analysis of the chart highlights an emerging bullish trend. Recent price actions suggest a recovery
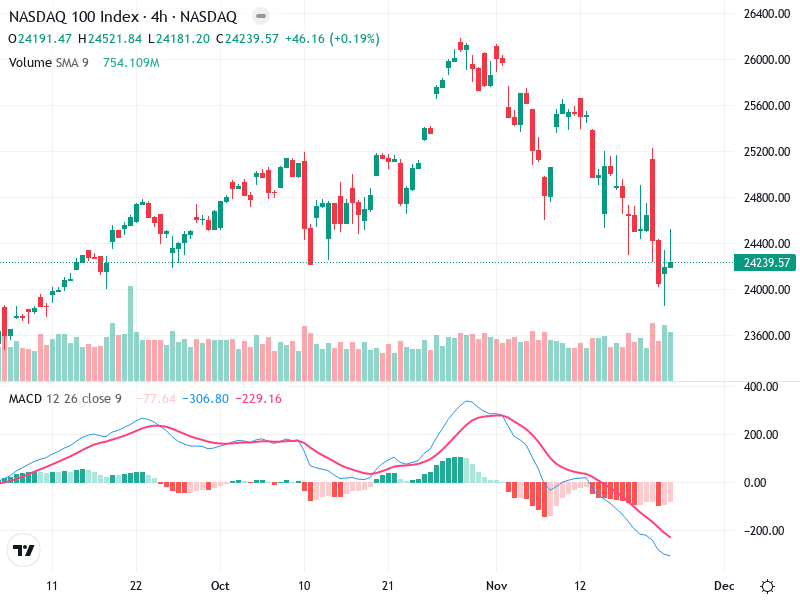
The NASDAQ 100 index chart shows signs of a recovery as it transitions from a recent
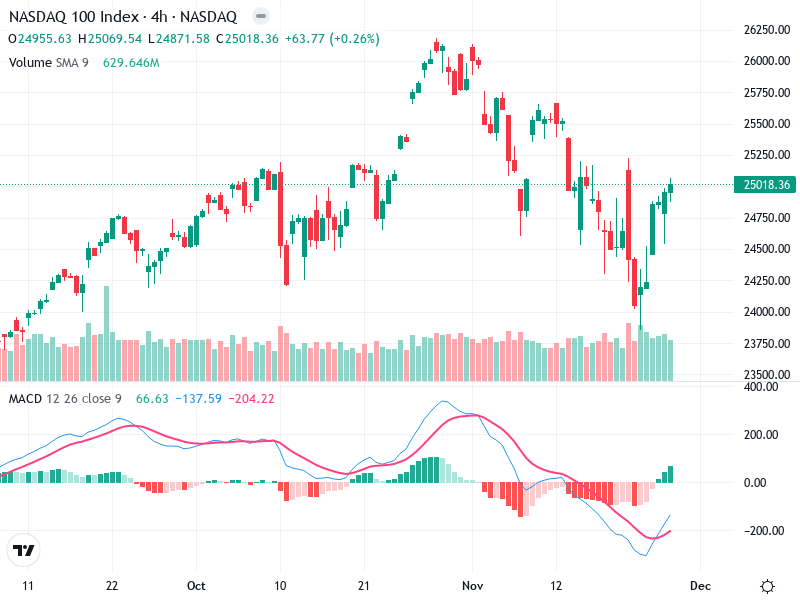
The chart provides a detailed examination of the current trends and technical indicators for . With
The asset’s chart has shown notable movements in recent days. There is a potential shift in
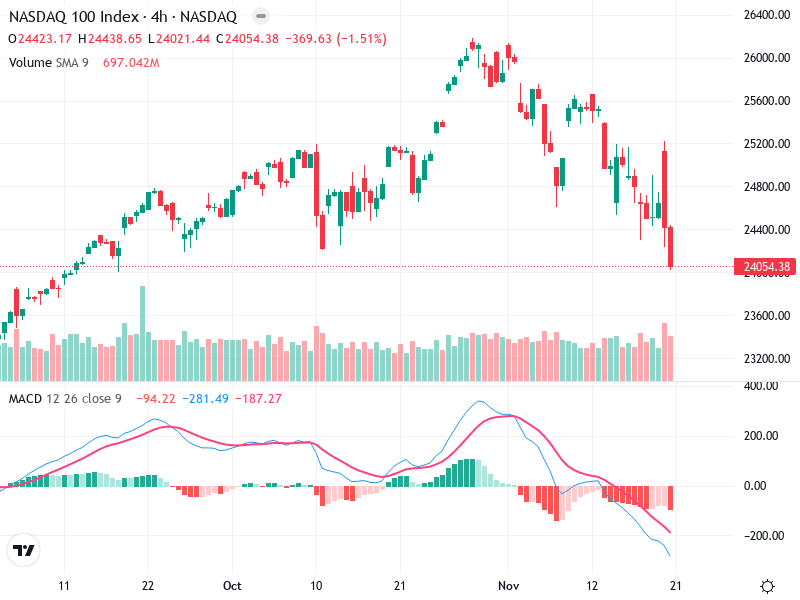
The NASDAQ 100 Index chart reveals significant insights into its current state. The index is experiencing
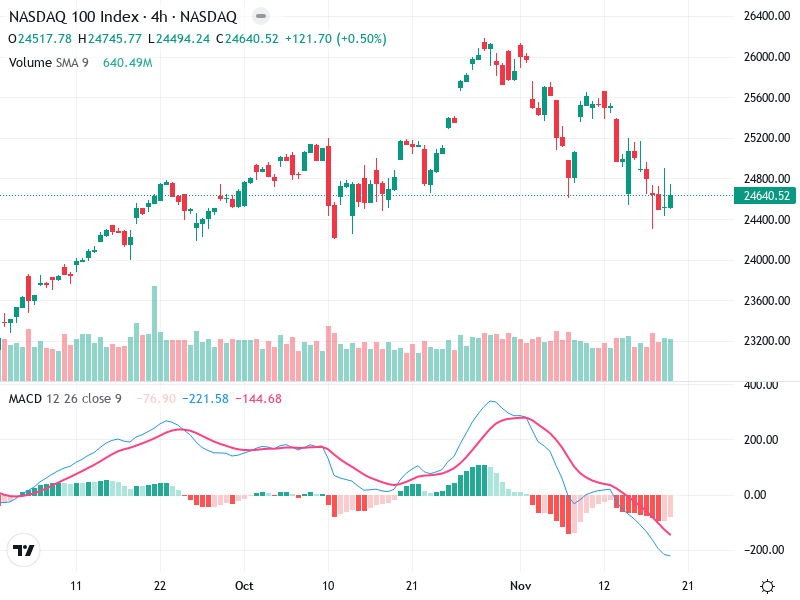
The NASDAQ 100 Index chart reflects recent market activities and potential directional shifts. Key levels and
