NSDQ – Technical Analysis – 4h
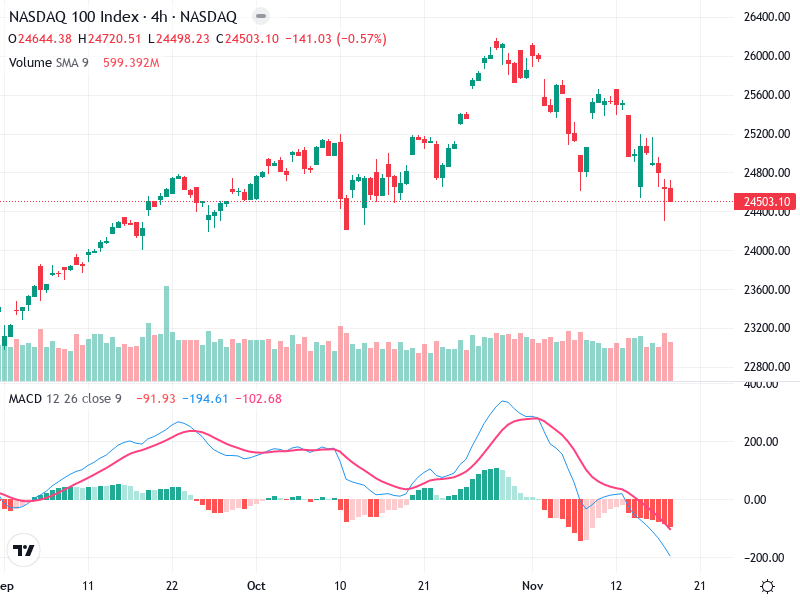
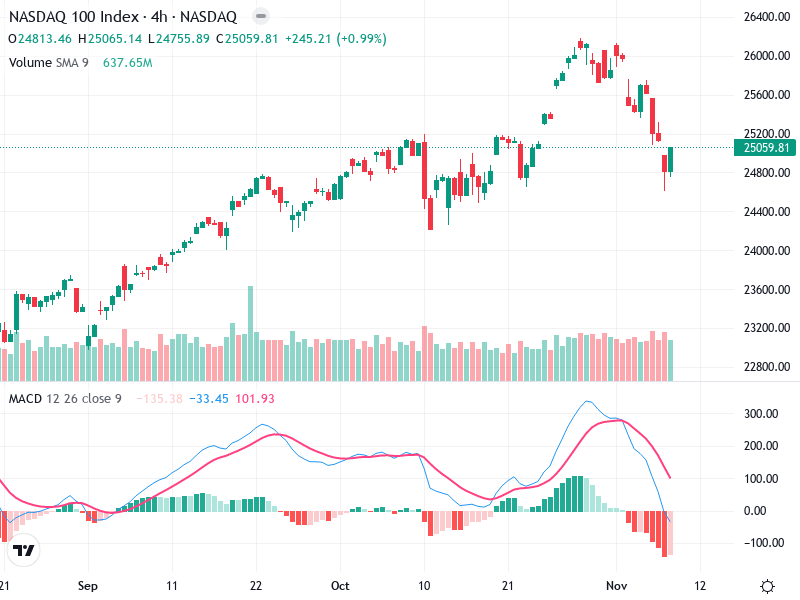
The NASDAQ 100 Index is currently witnessing a bearish trend, as evidenced by its technical indicators.
The NASDAQ 100 Index is currently witnessing a bearish trend, as evidenced by its technical indicators.
The NASDAQ 100 Index chart indicates current consolidation with low volume, suggesting a prevailing caution among

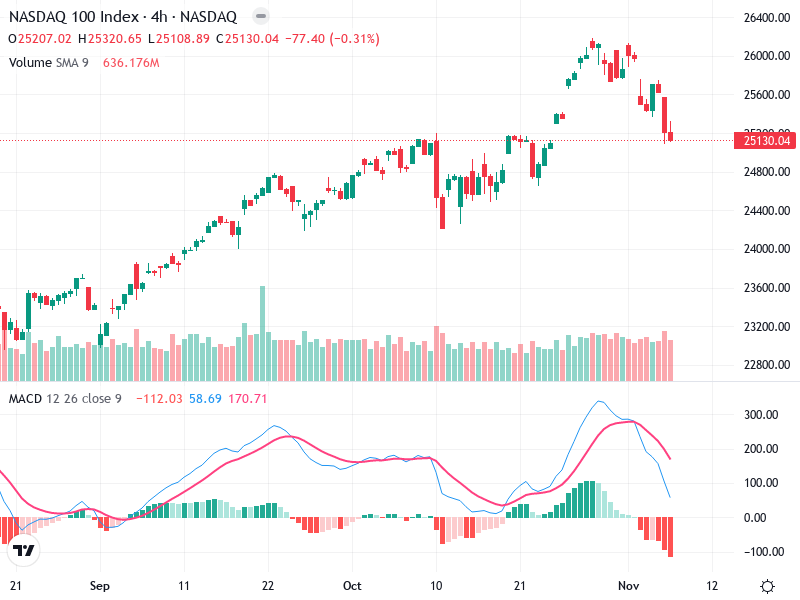
The NASDAQ 100 chart shows significant recent movements, reflecting a broader bearish sentiment. Key levels are

The NASDAQ 100 Index is currently in a consolidation phase. Critical levels to watch are 25,200
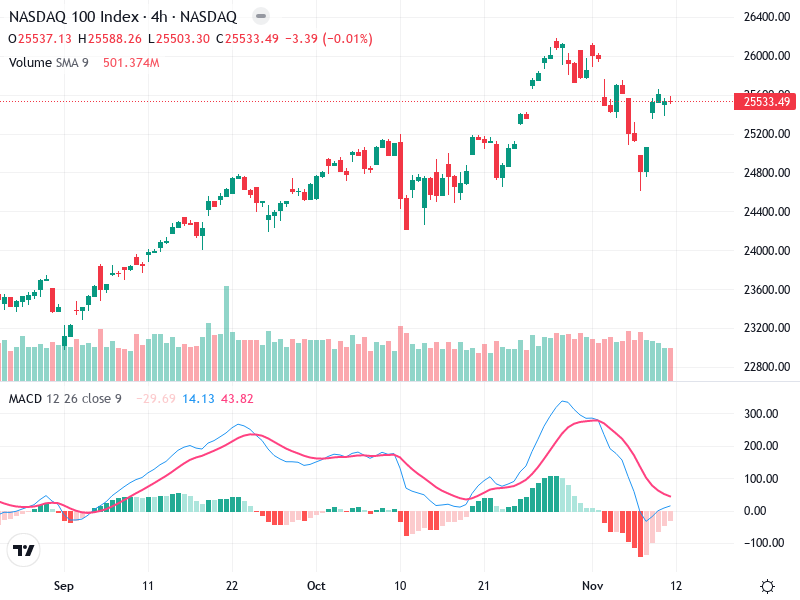
The asset is witnessing a potential transition phase in its market sentiment. It’s important to watch
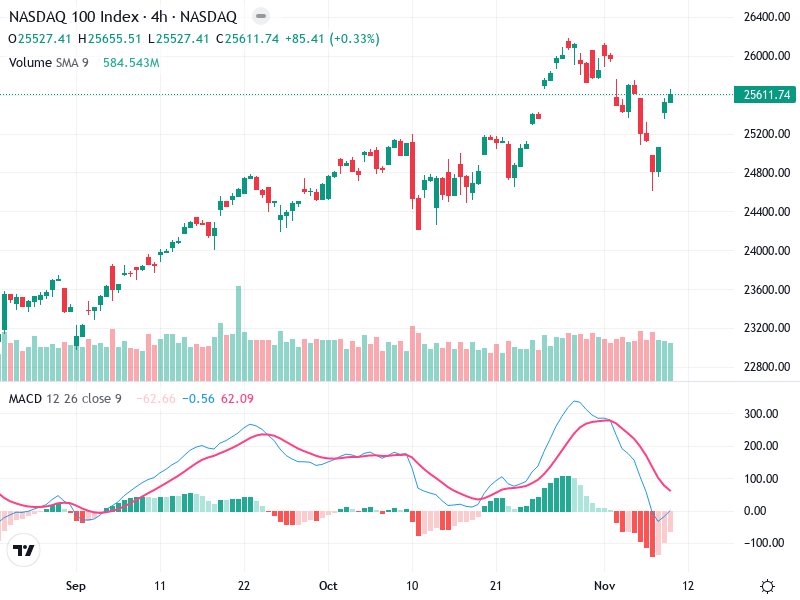
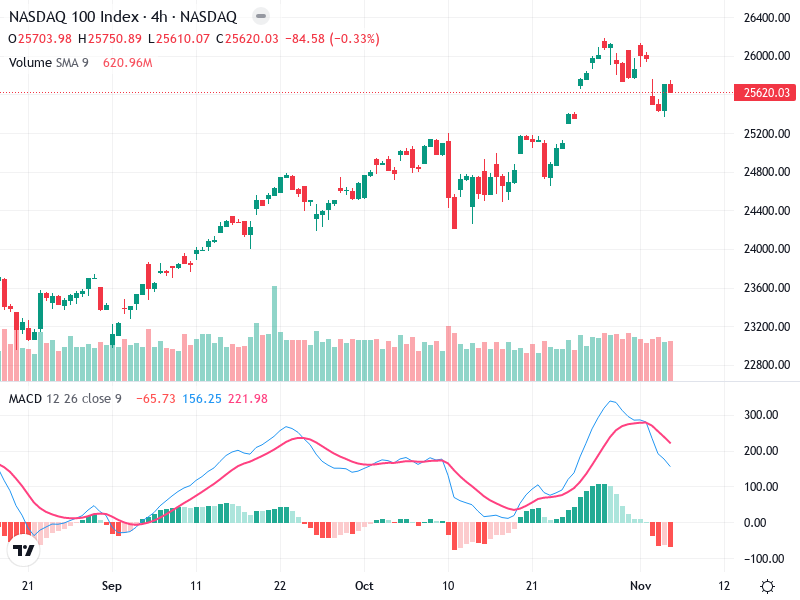
The asset’s recent price movement suggests a potentially bullish trend as observed through key technical indicators.
The NASDAQ 100 Index chart suggests a potential trend reversal following a recent pullback. The index
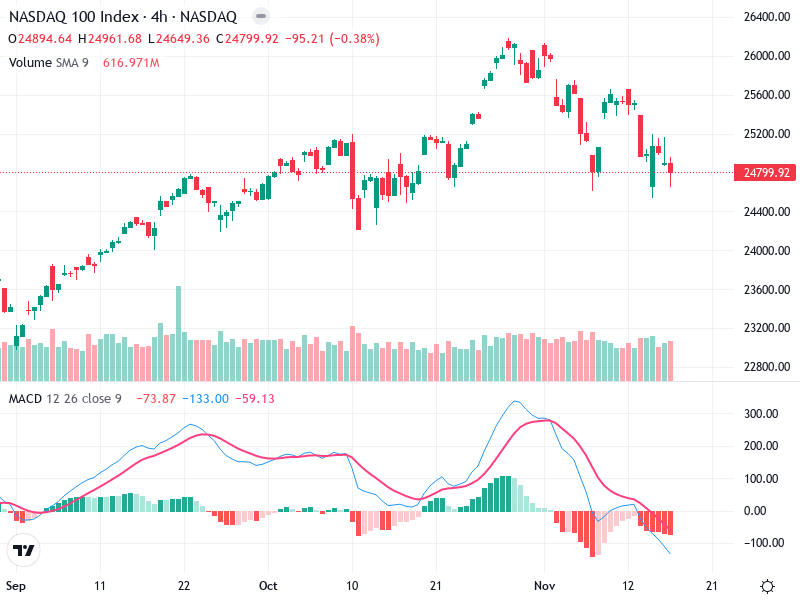
The NASDAQ 100 chart currently reflects a bearish sentiment with recent downturns. The asset has seen
The chart of has exhibited distinct trading behaviors in recent months. Notably, the asset displayed a

The NASDAQ 100 Index is under technical scrutiny with recent movements indicating a potential shift in
