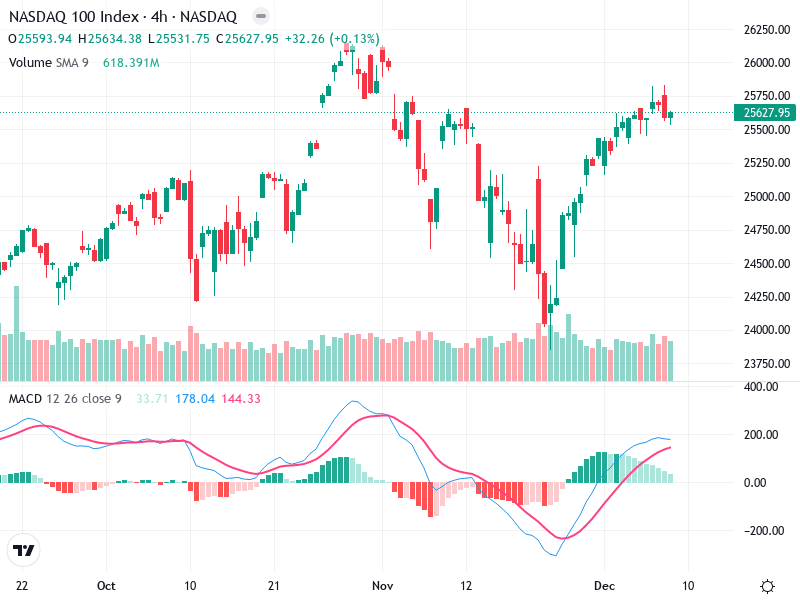
NSDQ – Technical Analysis – 4h
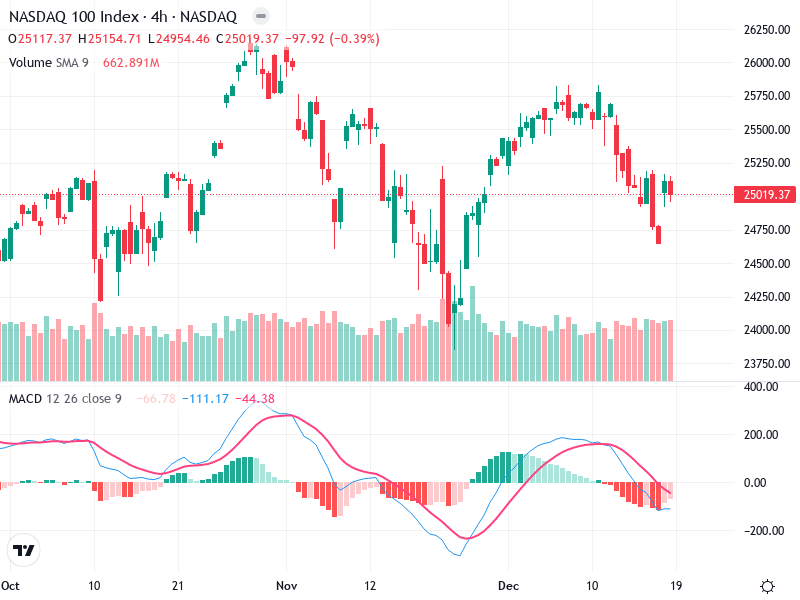
The NASDAQ 100 is currently experiencing a period of indecision, as evidenced by recent market patterns.
The NASDAQ 100 is currently experiencing a period of indecision, as evidenced by recent market patterns.
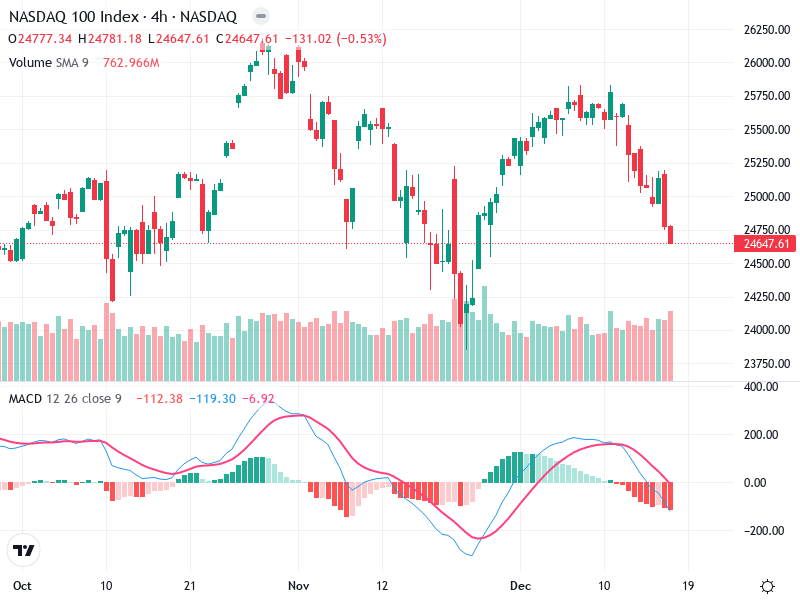
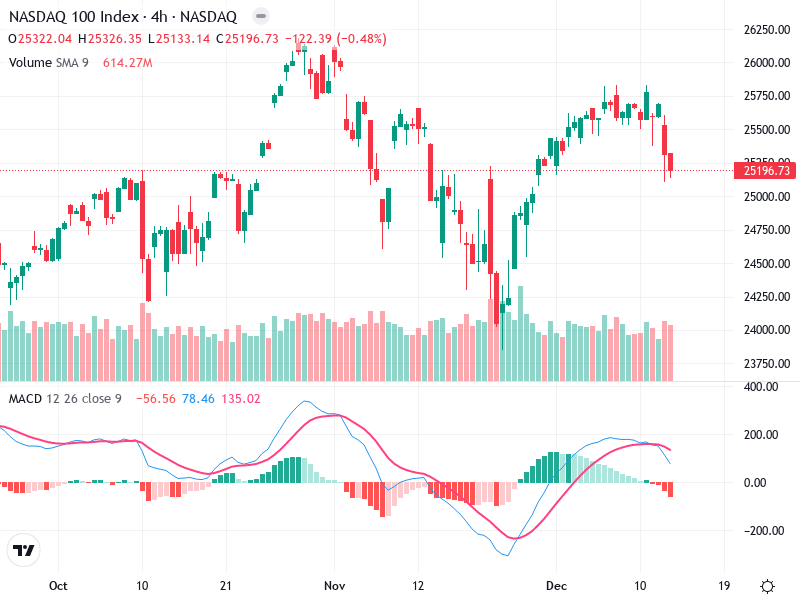
The chart analysis for Asset indicates a prominent bearish trend. Recent candlestick patterns and volume changes
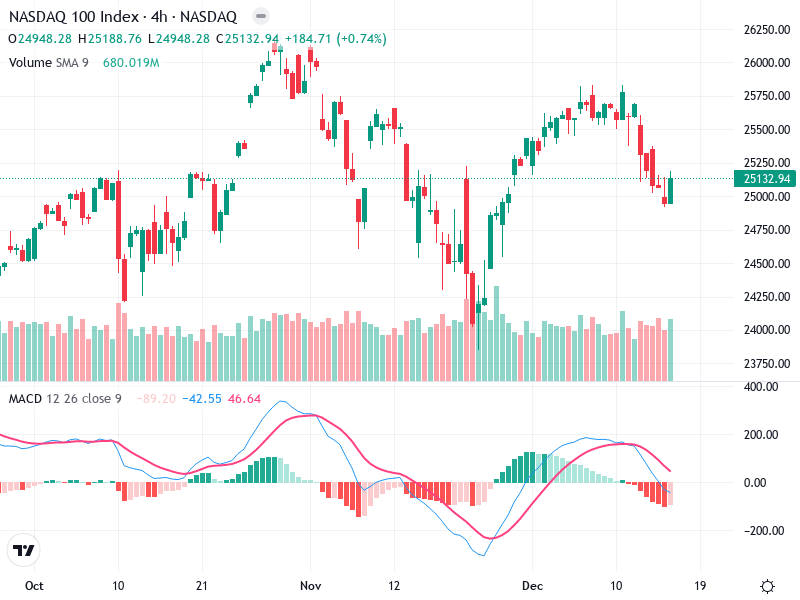
The NASDAQ 100 Index shows a dynamic trend with potential for a directional shift. Recent analysis
The chart of is showing crucial levels that could dictate future price movements. Currently, the market
The chart presents a clear analysis of the current market conditions for . It highlights the
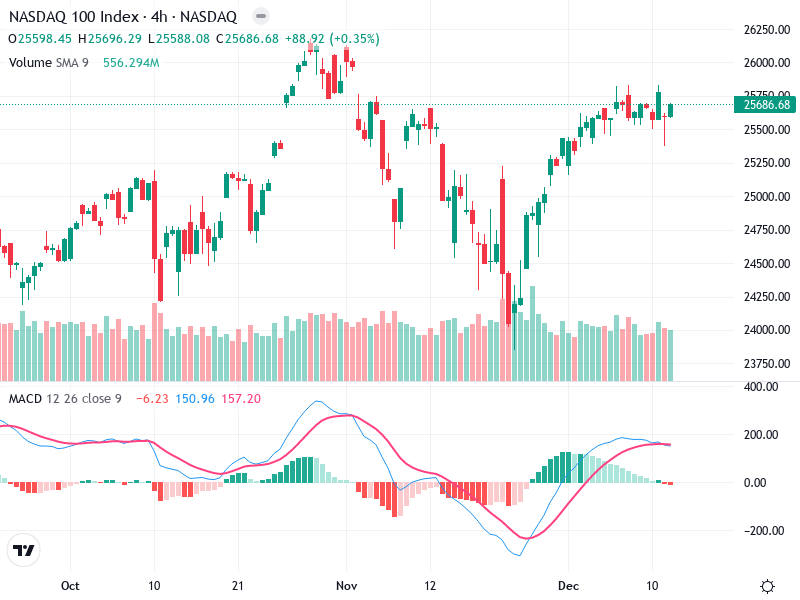
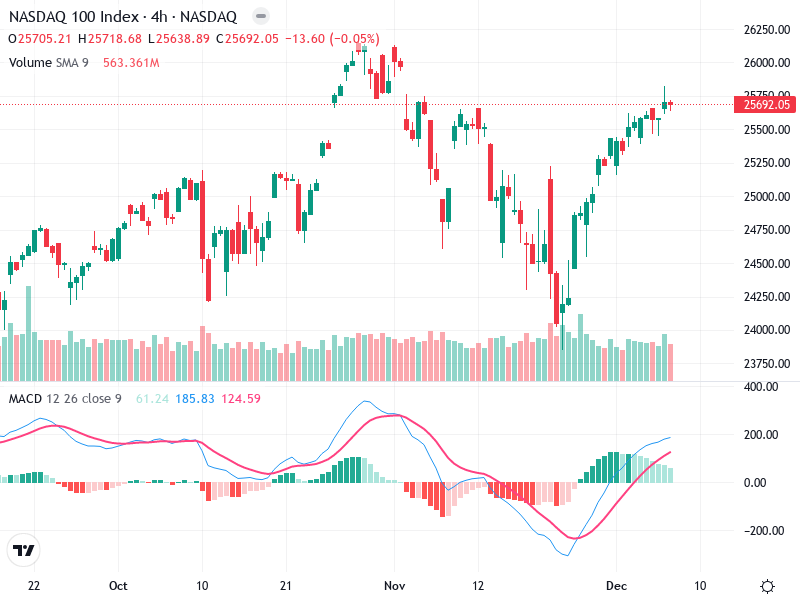
The NASDAQ 100 Index has exhibited a mix of trends recently. After experiencing a downtrend, there
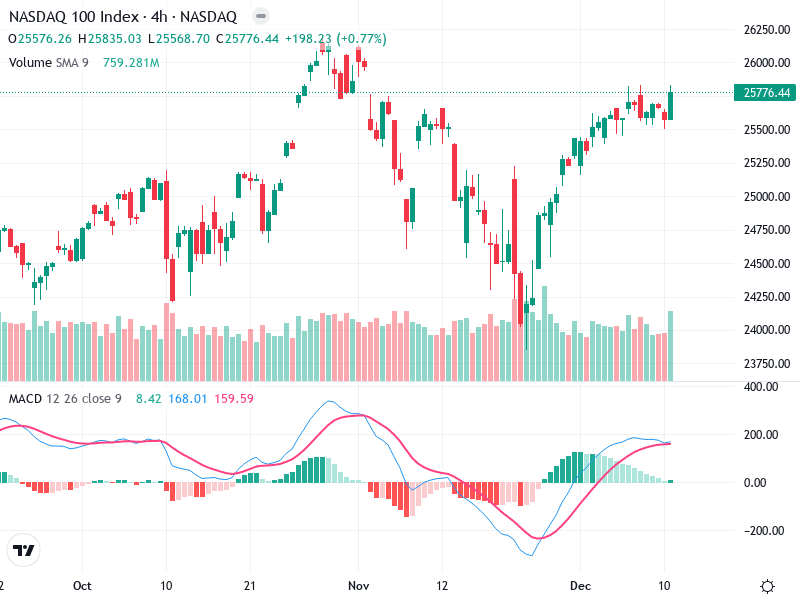
The NASDAQ 100 Index 4H chart showcases recent bullish momentum. A significant breakout could signal further
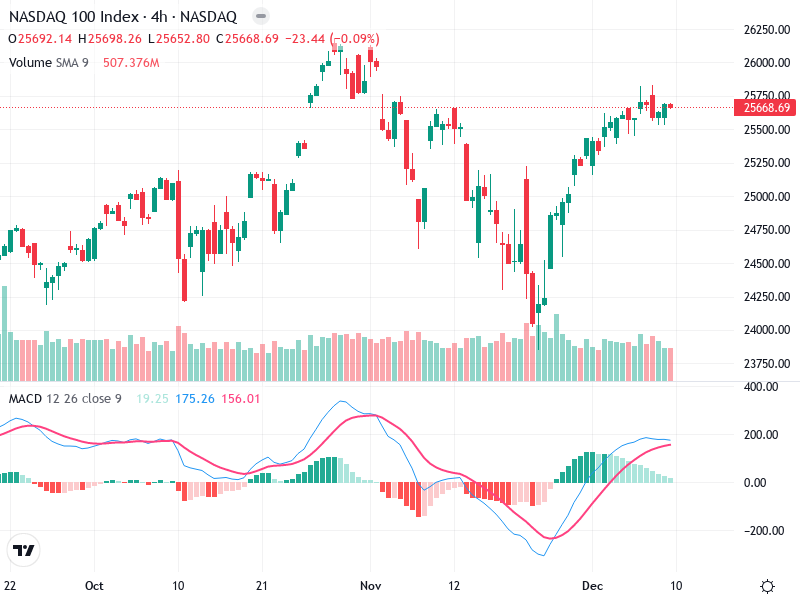
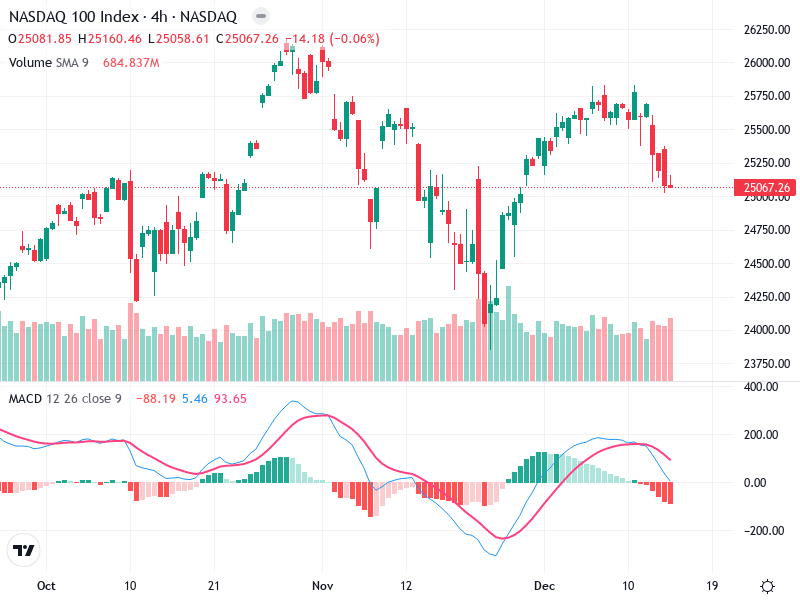
The NASDAQ 100 Index is displaying a mix of consolidation and potential breakout signals on its
The chart showcases recent movements with a notable trend. Indicators reflect a potential shift in market
This technical analysis provides insights into the Asset’s current market condition. The Asset is currently displaying
