NSDQ – Technical Analysis – 4h
The chart shows significant trends in the market. Current patterns indicate potential shifts in momentum. Key
The chart shows significant trends in the market. Current patterns indicate potential shifts in momentum. Key
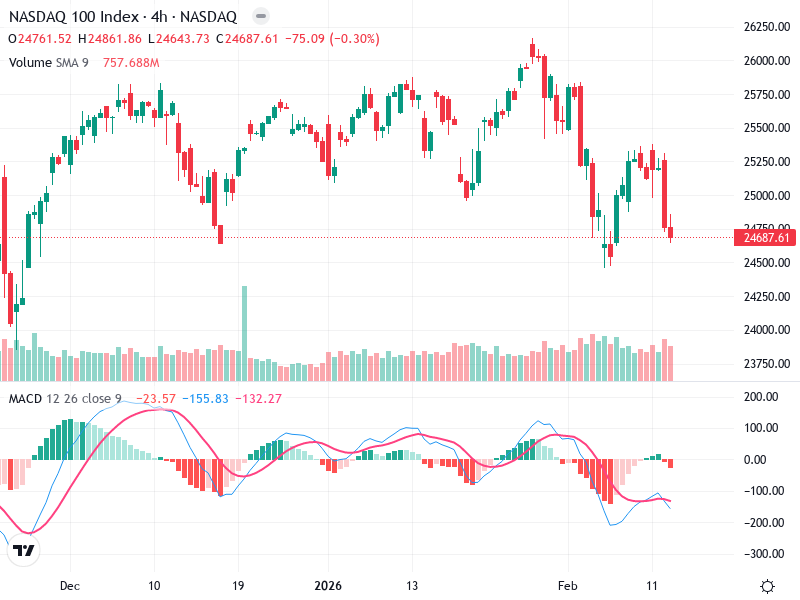
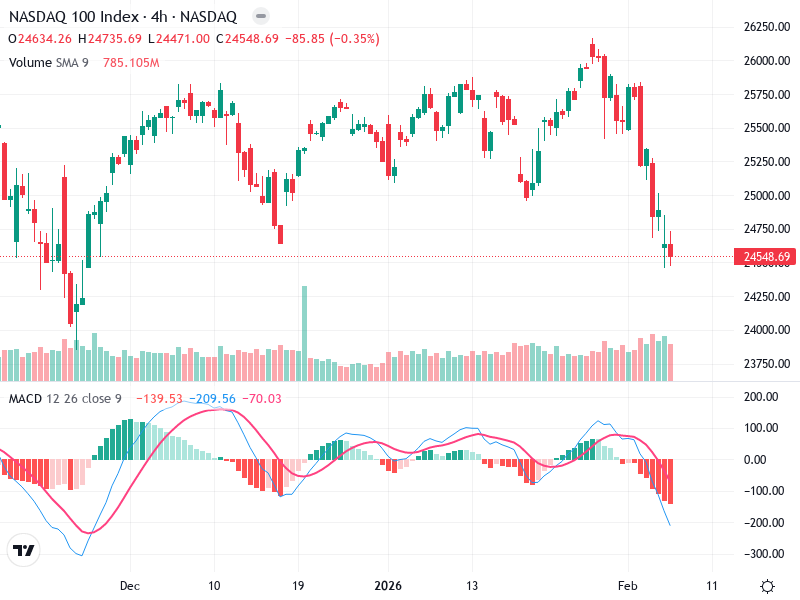
The chart analysis for highlights significant patterns in candlestick formations and technical indicators. Currently, a bearish

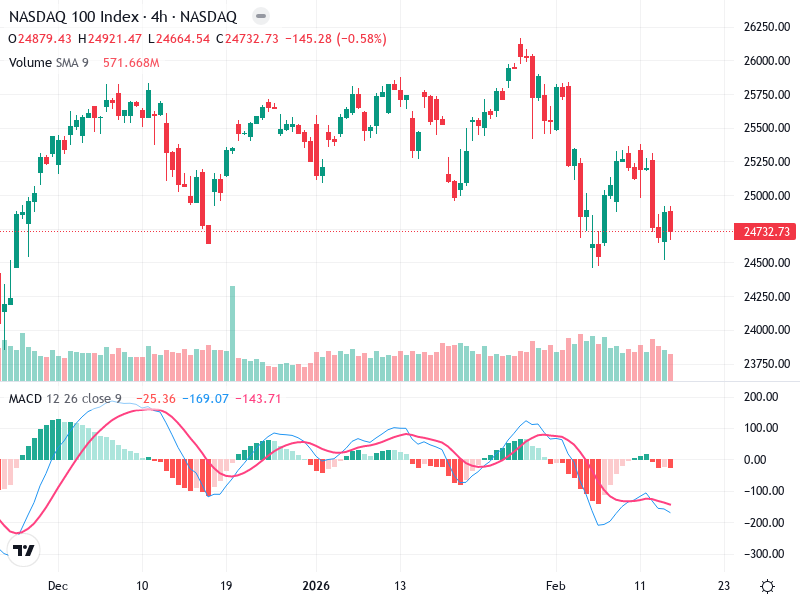
The current technical analysis of the asset shows a bearish sentiment prevailing in the market. Lower

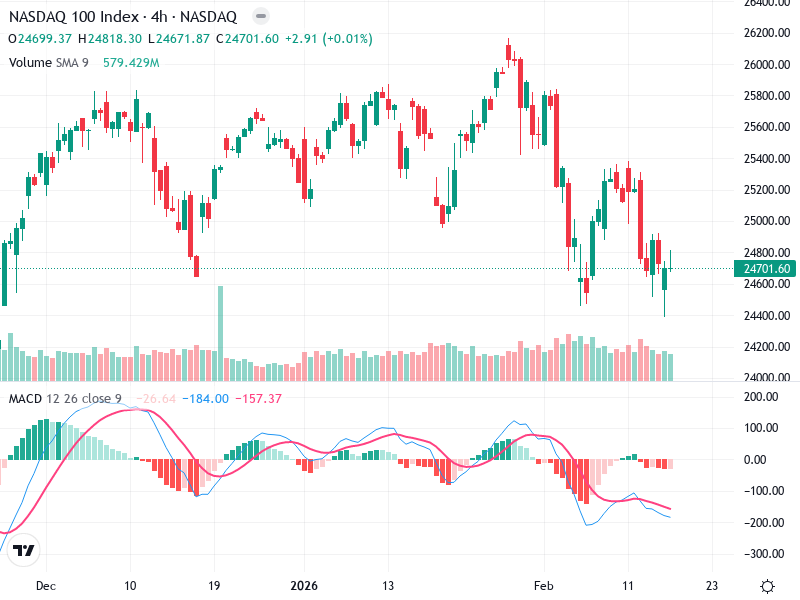
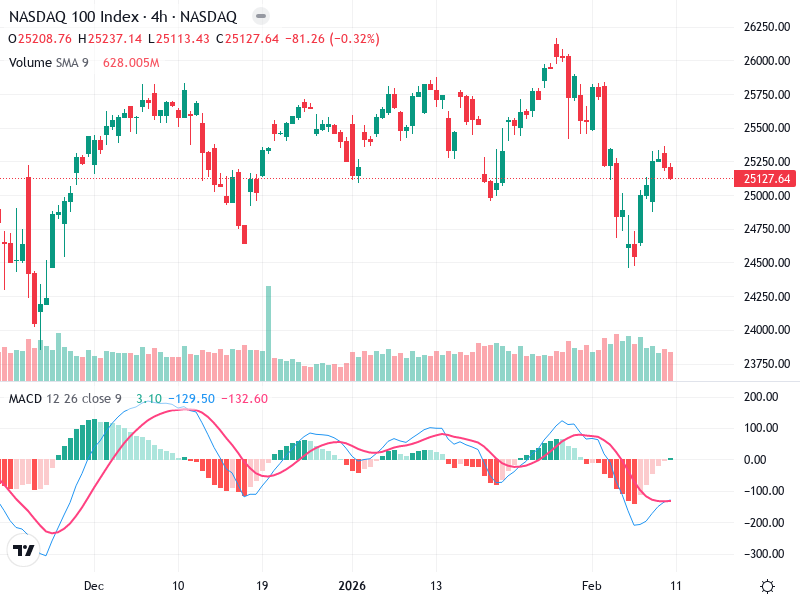
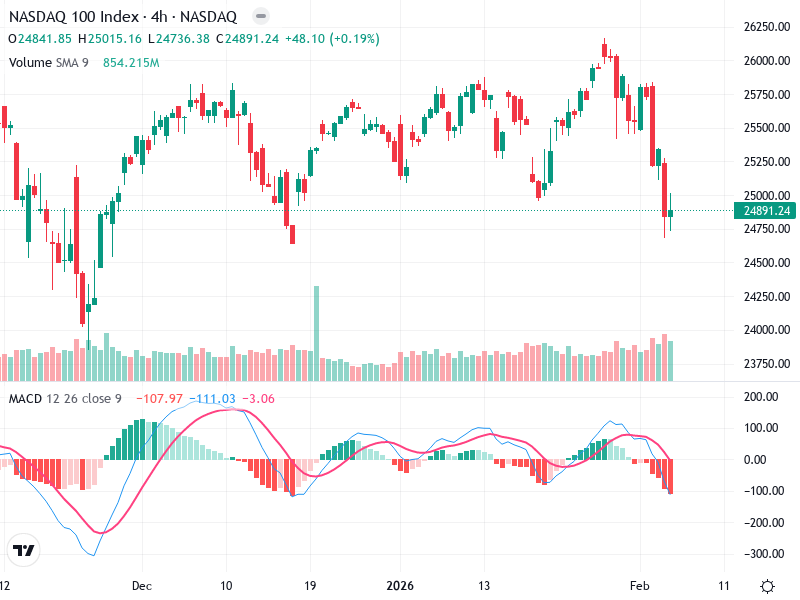
The NASDAQ 100 Index chart is currently exhibiting a bearish trend with significant downward pressure. The
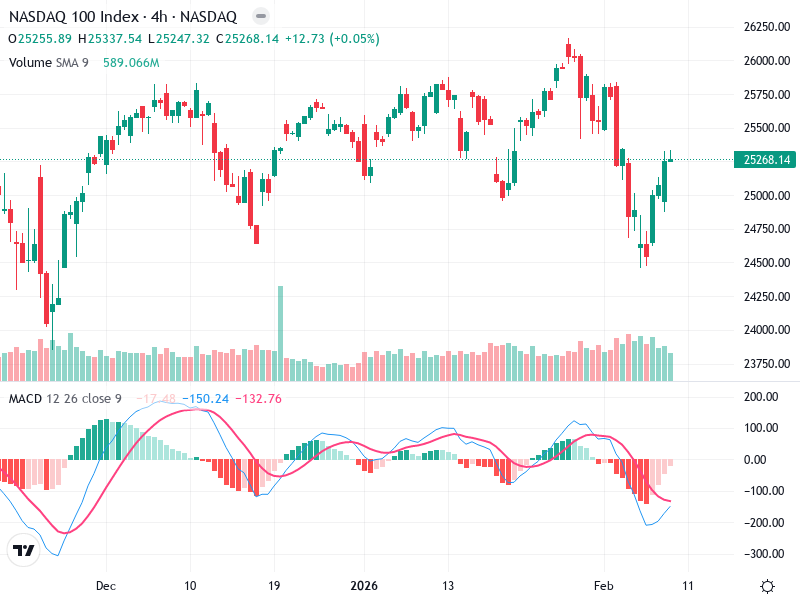
The NASDAQ 100 Index chart reveals a period of potential consolidation after a recent decline. Analysis
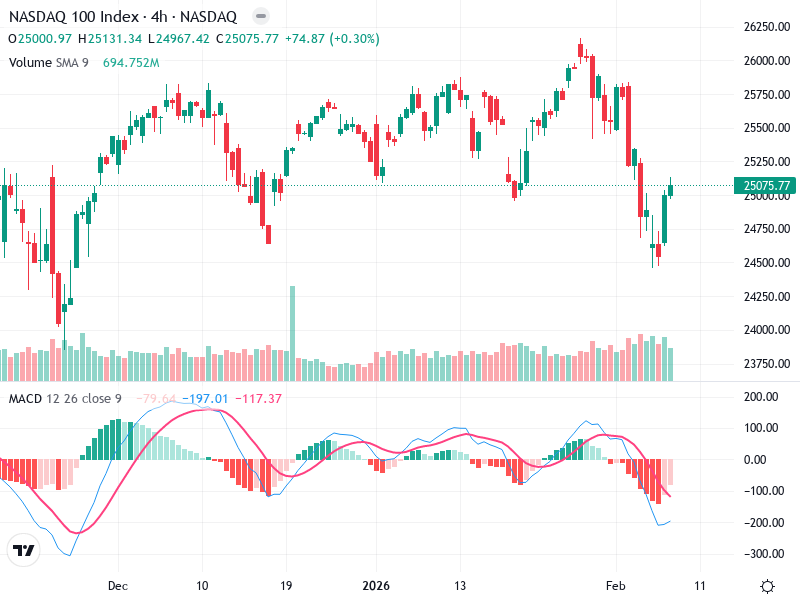
The NASDAQ 100 chart highlights a potential shift in market sentiment with technical indicators suggesting a
The chart for this asset reflects recent market dynamics with notable patterns and volume changes. Recent
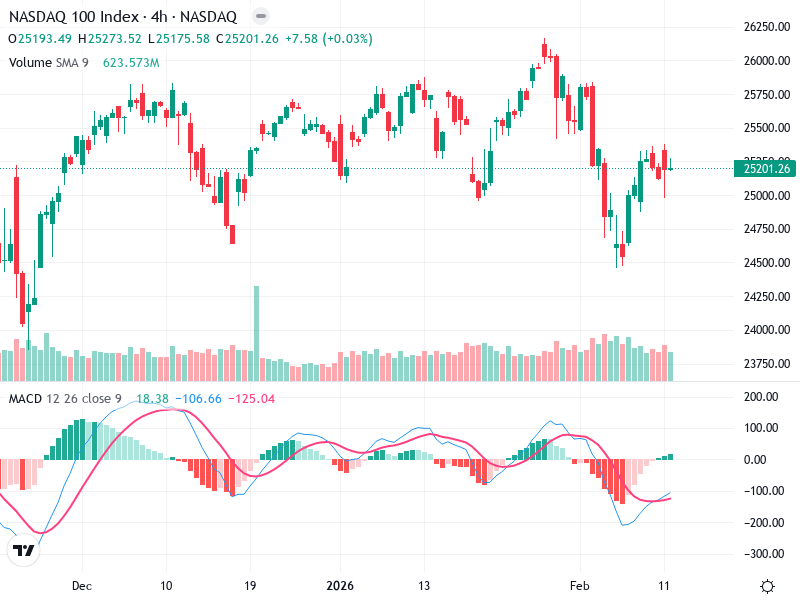
The NASDAQ 100 Index has shown signs of potential recovery following a recent downturn. Key technical
The NASDAQ 100 Index has been experiencing a notable downtrend characterized by lower highs and lower
The chart reflects a strong downward trend, intensified by recent large bearish candles. faces significant downward
