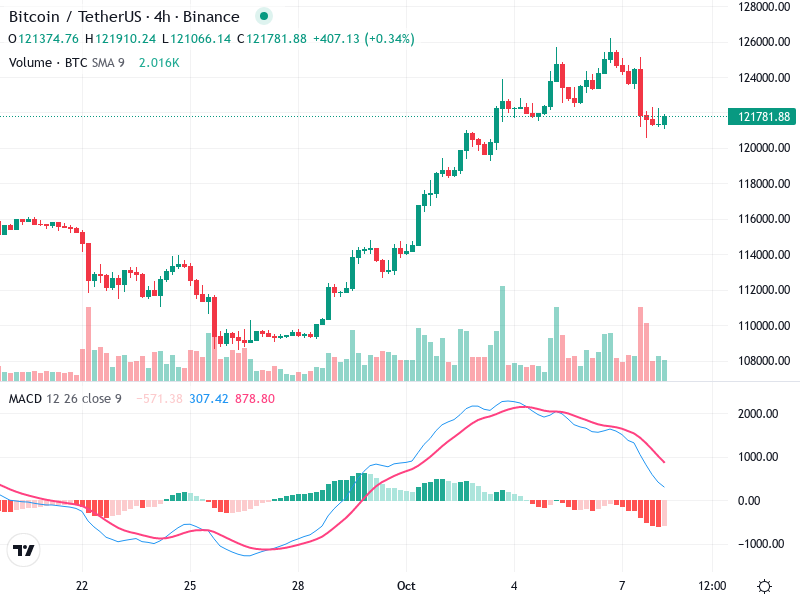
BTC/USD – Technical Analysis – 4h
The asset’s chart analysis reveals key insights into its current state. It displays trends that suggest
The asset’s chart analysis reveals key insights into its current state. It displays trends that suggest
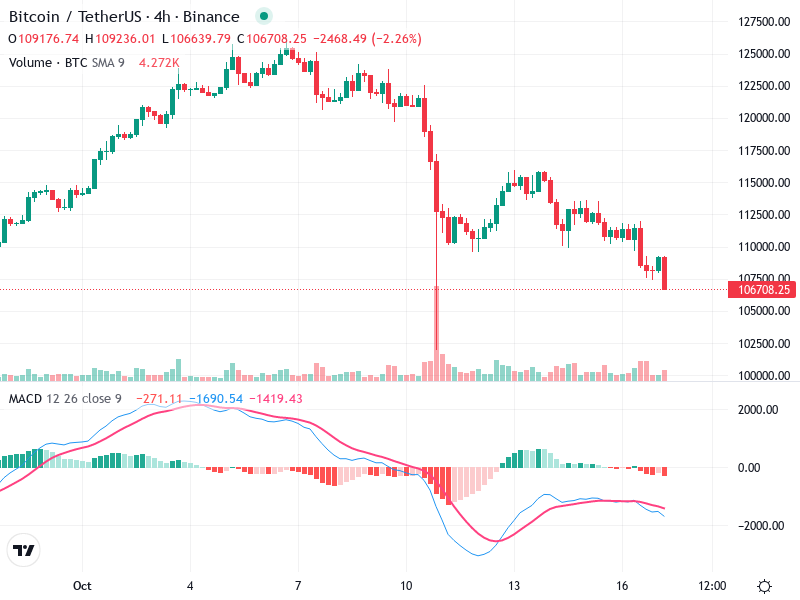
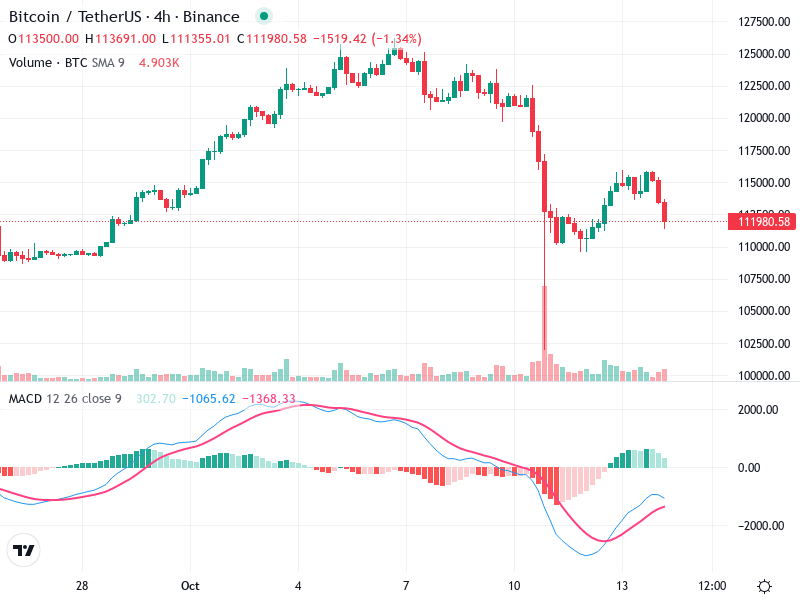
The Bitcoin/TetherUS chart exhibits notable trends with clear bearish signs. Observations suggest a strong sell-off, marked
The 4-hour chart for Bitcoin/TetherUS shows a predominant bearish trend with attempts at consolidation. The asset
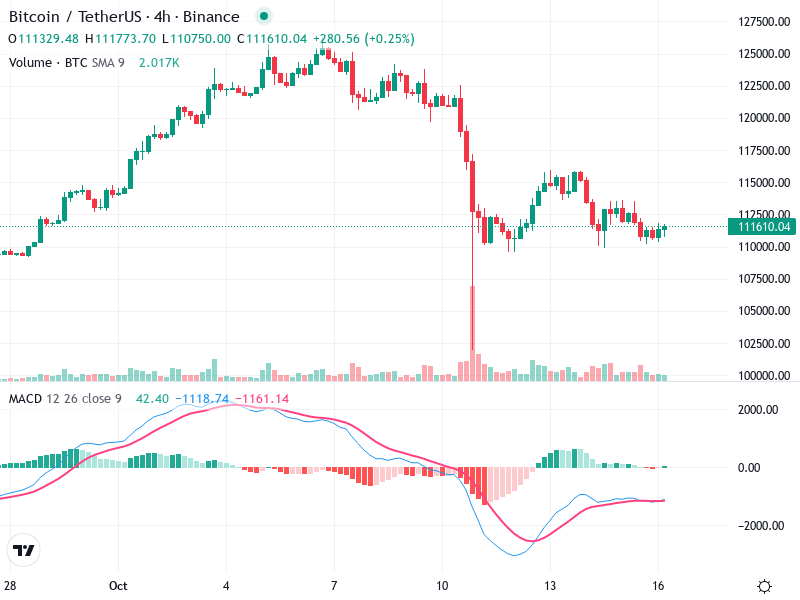
The chart is currently displaying signs of stabilization following a recent trend. Key levels to observe
The Bitcoin/TetherUS chart on the 4-hour timeframe shows significant bearish pressure. The recent price action and
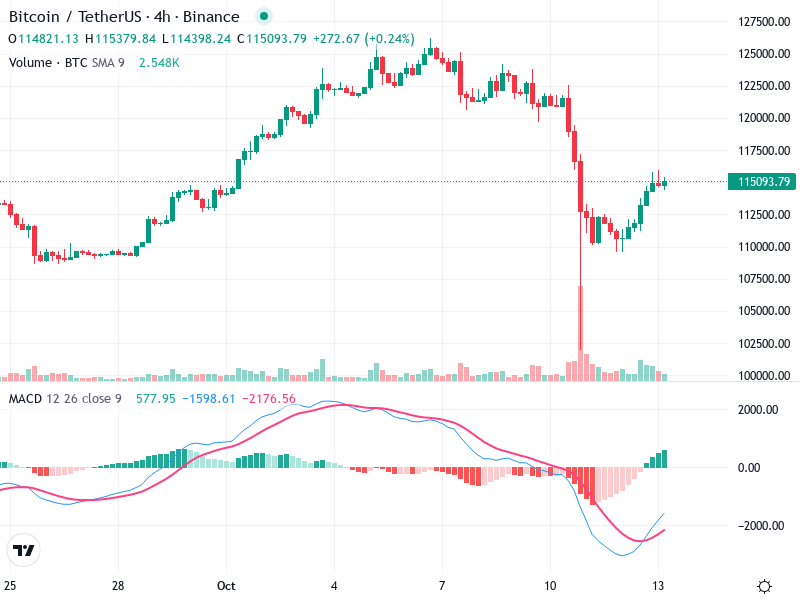
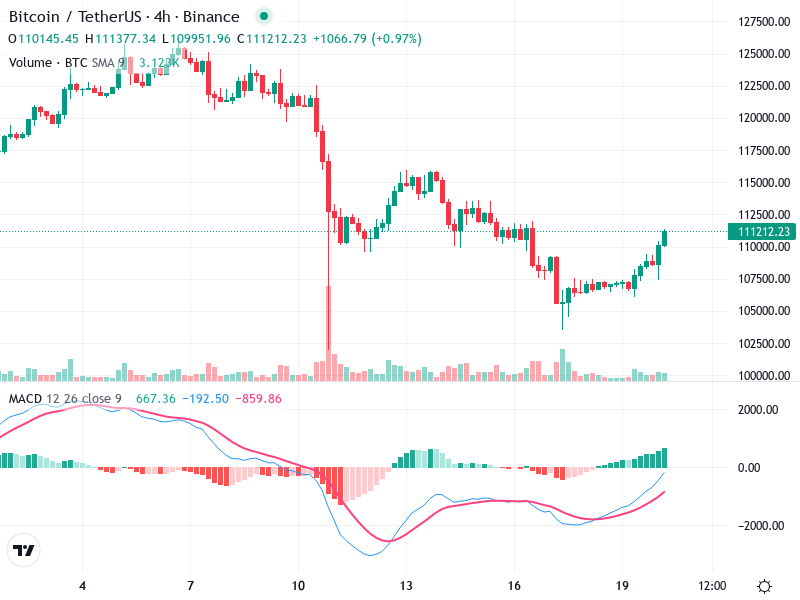
The Bitcoin/TetherUS chart indicates signs of a potential bullish reversal following a recent bearish trend. Key
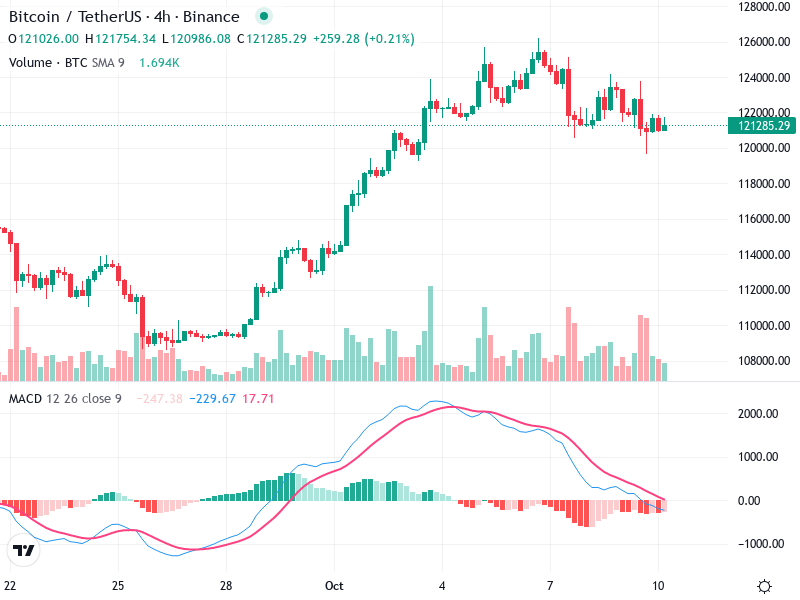
The chart of shows a clear consolidation phase with key levels at play. The asset demonstrates
The asset chart demonstrates key technical elements that provide insight into future price movements. The current
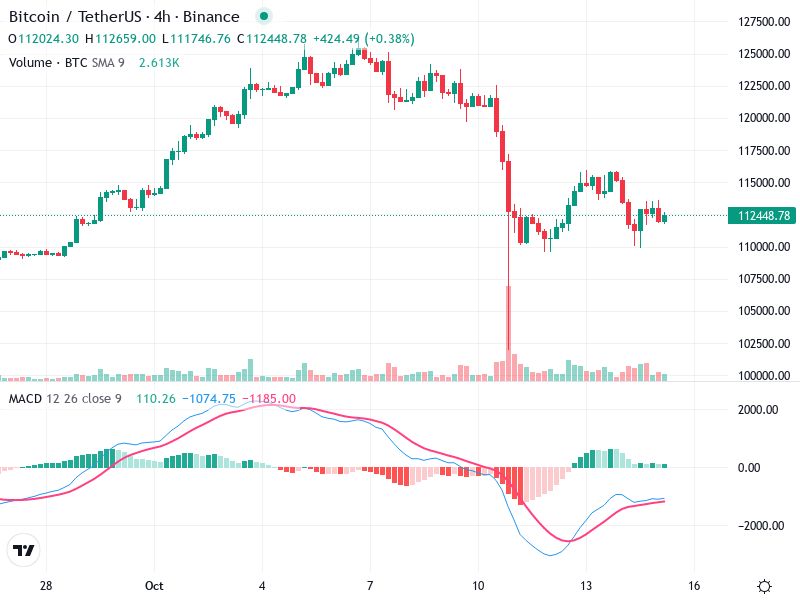
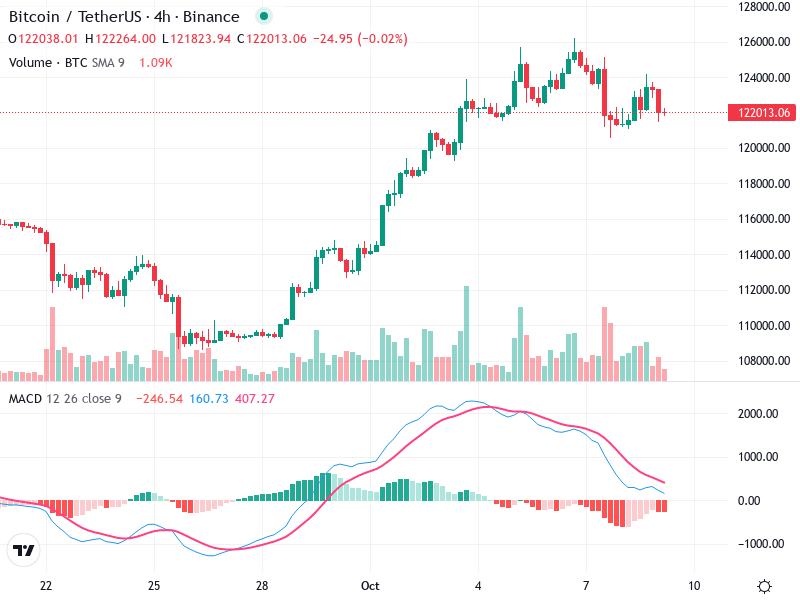
The Bitcoin/TetherUS 4-hour chart illustrates recent market movements, highlighting a transition from a bullish trend with
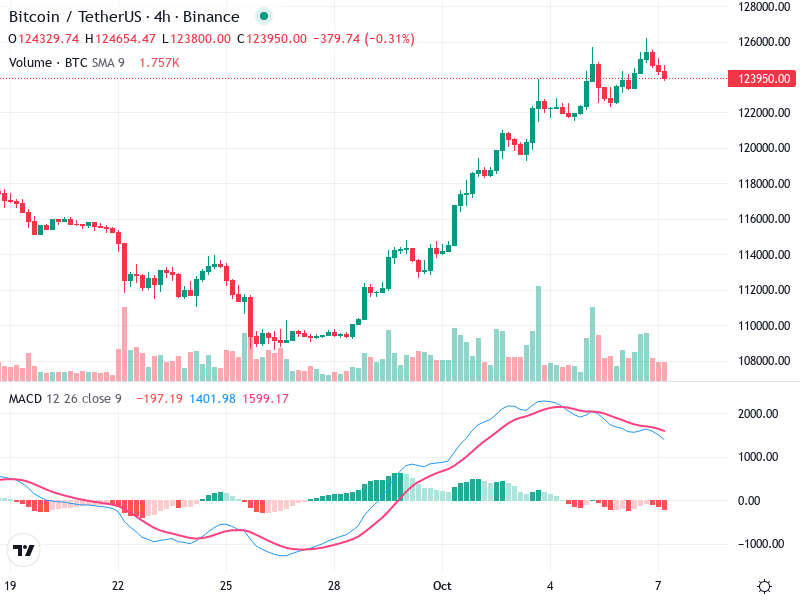
The chart shows a notable bullish trend characterized by a series of higher highs and higher
