NSDQ – Technical Analysis – 4h
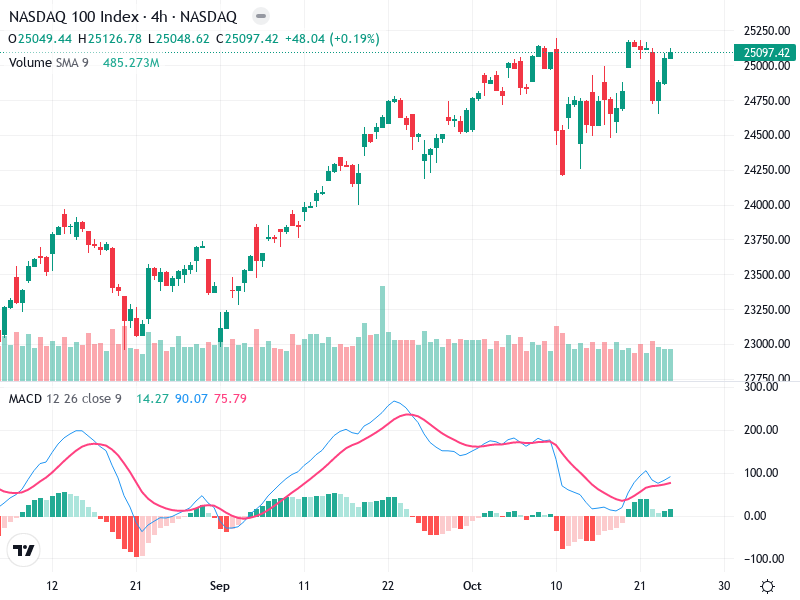
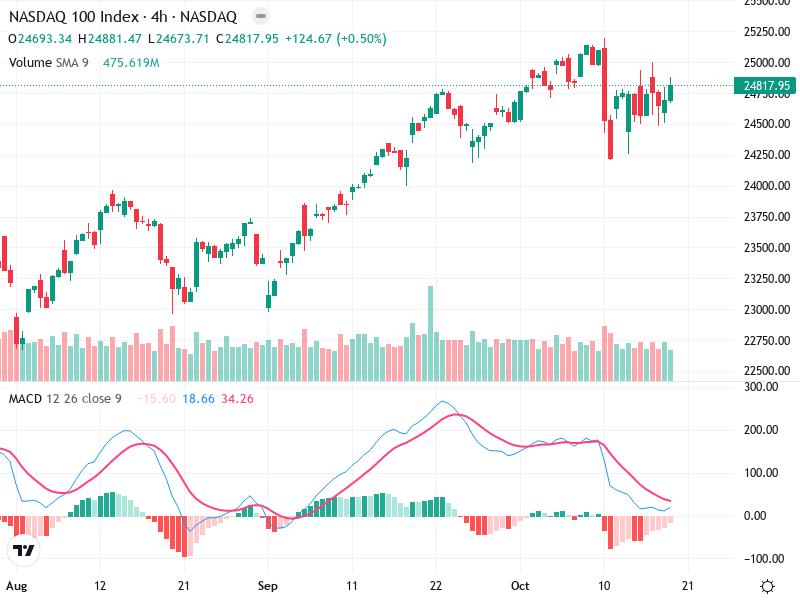
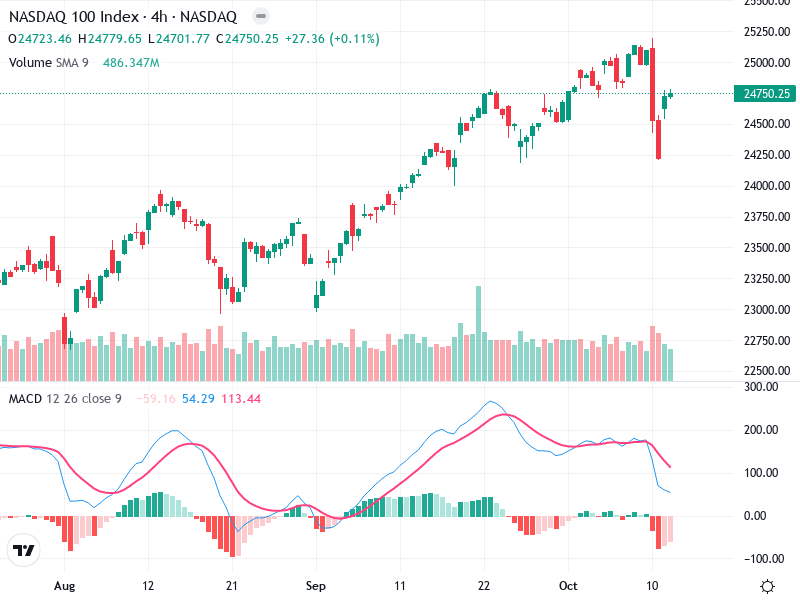
The NASDAQ 100 Index chart shows a strong bullish trend, with higher highs and higher lows.
The NASDAQ 100 Index chart shows a strong bullish trend, with higher highs and higher lows.
The NASDAQ 100 Index is analyzed on a 4-hour chart, showing significant movements over the past
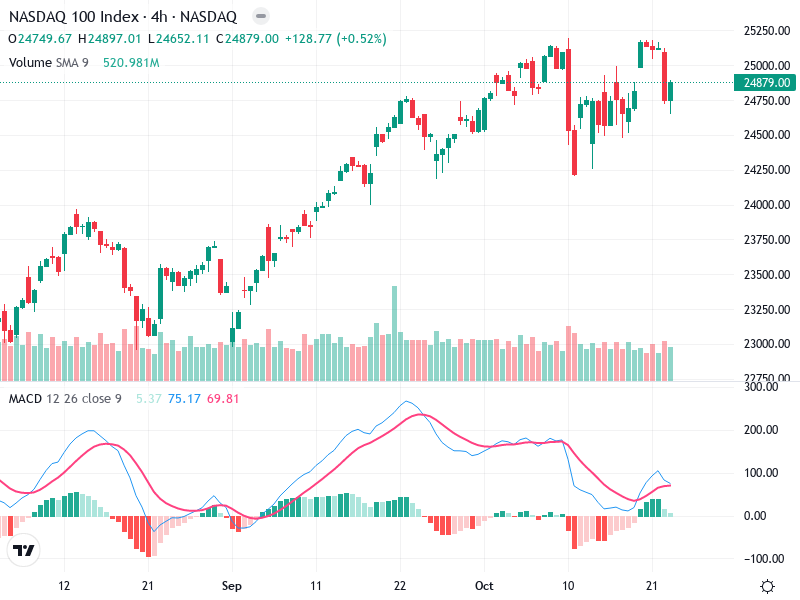
The NASDAQ 100 Index 4h chart displays key insights for traders. It highlights technical indicators that
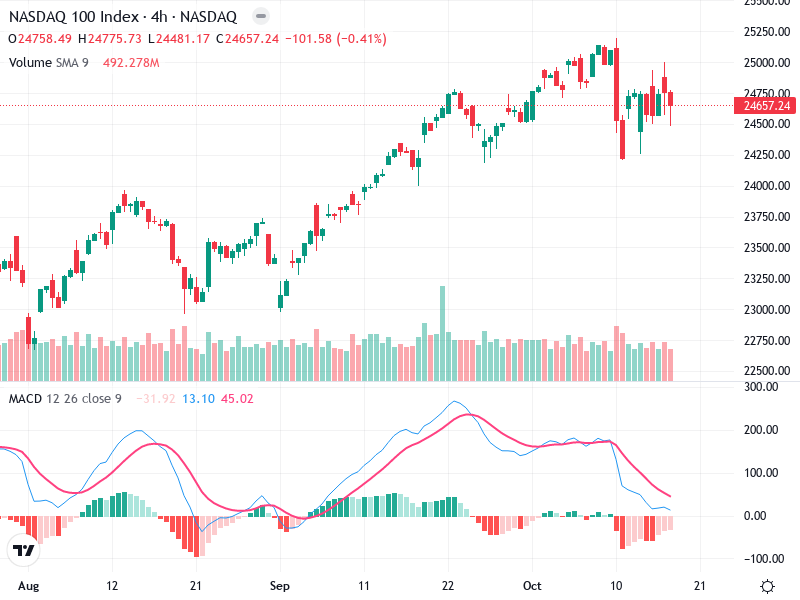
The NASDAQ 100 has shown significant bullish trends with recent breakouts confirming upward momentum. The price
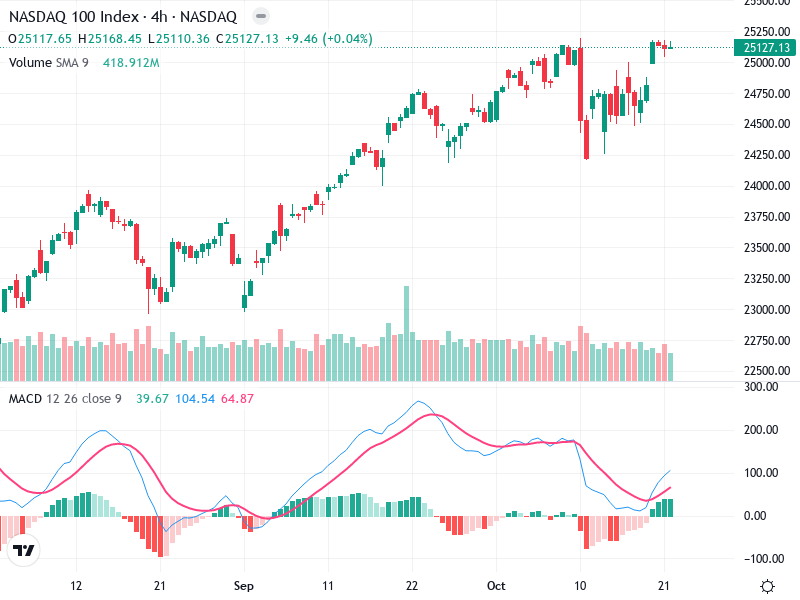
The chart presents a detailed view of its recent performance, capturing significant movements and trends. This
The NASDAQ 100 Index has experienced a strong bullish rally from mid-September to early October. It
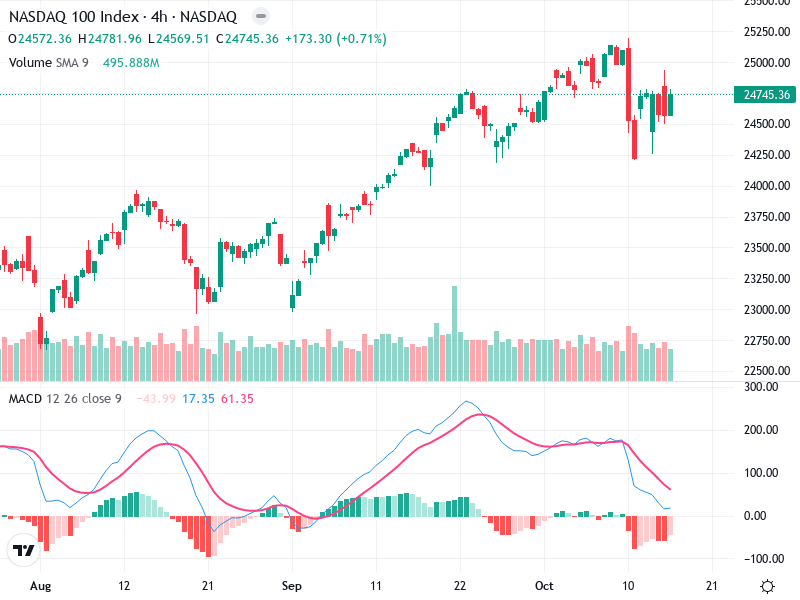
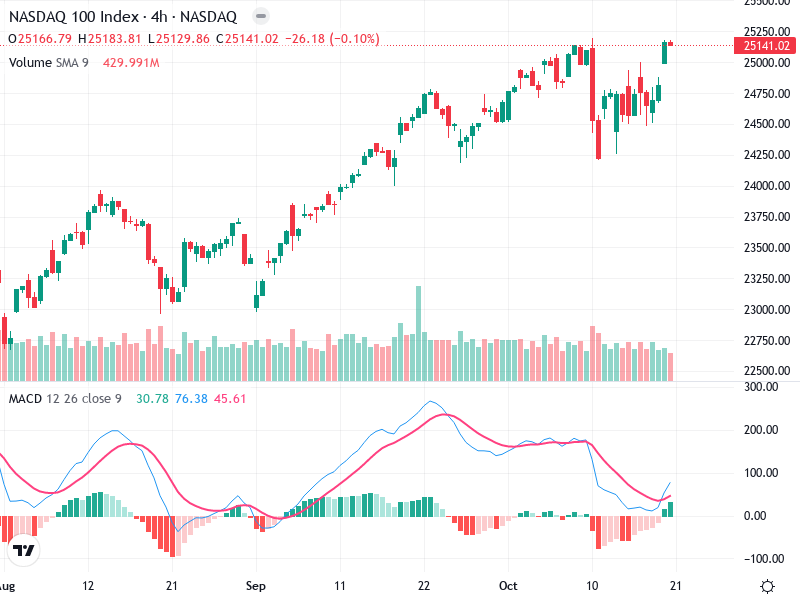
The chart for the Asset shows intriguing patterns that may point to future movements. Overall, it
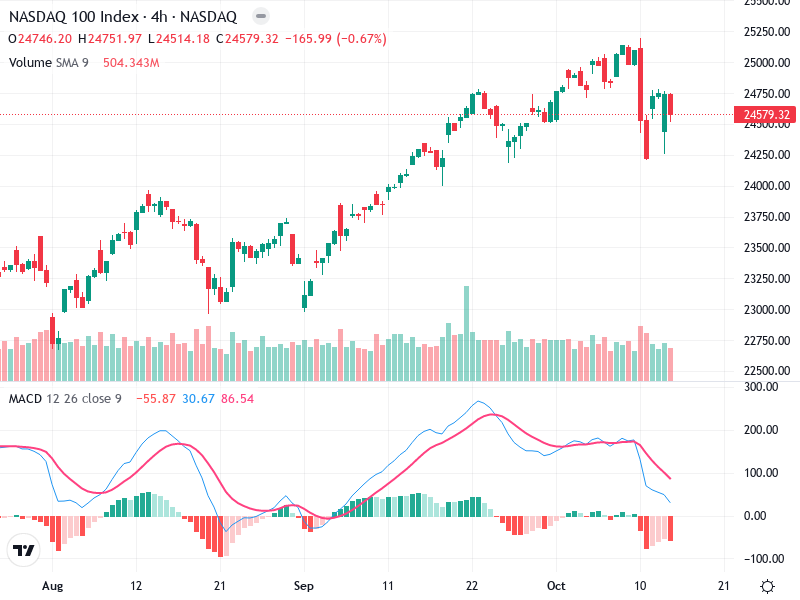
The asset’s chart displays recent fluctuations, highlighting key levels of support and resistance. The recent price
The chart illustrates recent movements in with notable fluctuations. Despite a brief pullback, there are signs
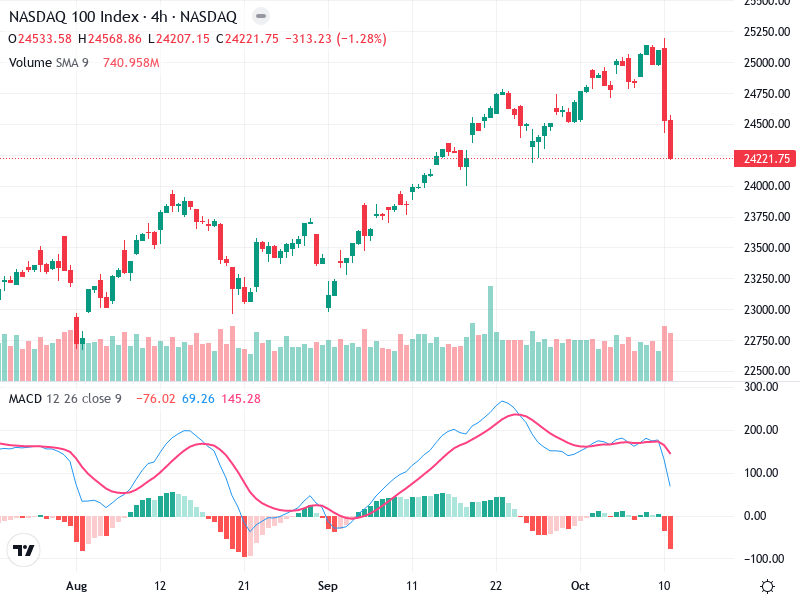
The chart of reveals remarkable patterns in recent price movements. The asset’s current trend shows shifts
