NSDQ – Technical Analysis – 4h
The analysis focuses on where the current chart setup reveals critical insights. Despite the bullish trend,
The analysis focuses on where the current chart setup reveals critical insights. Despite the bullish trend,
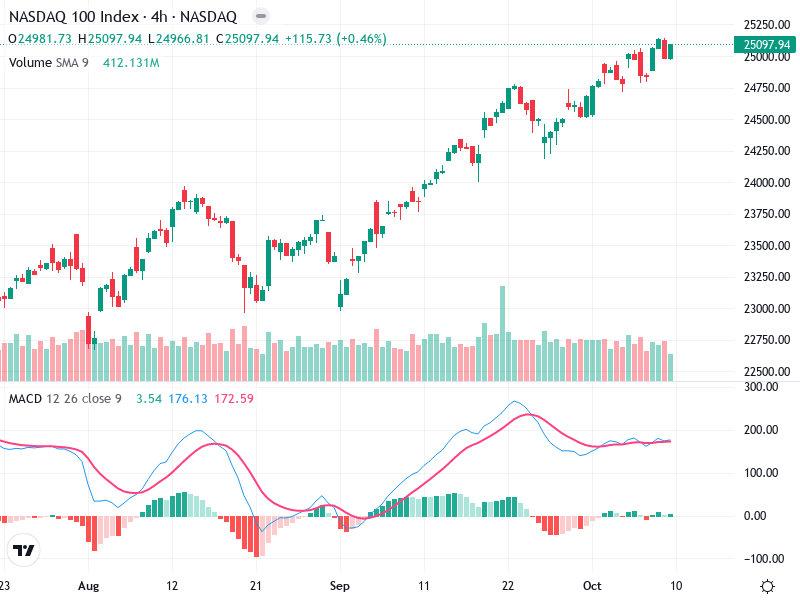
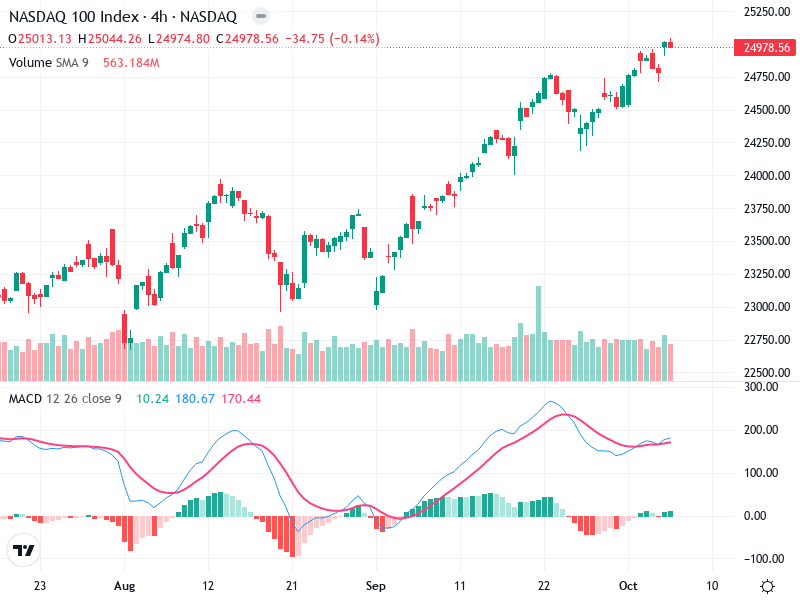
The NASDAQ 100 index is currently exhibiting a strong upward trend. With a series of higher
The chart indicates that the asset is demonstrating a strong upward trend, with higher highs and
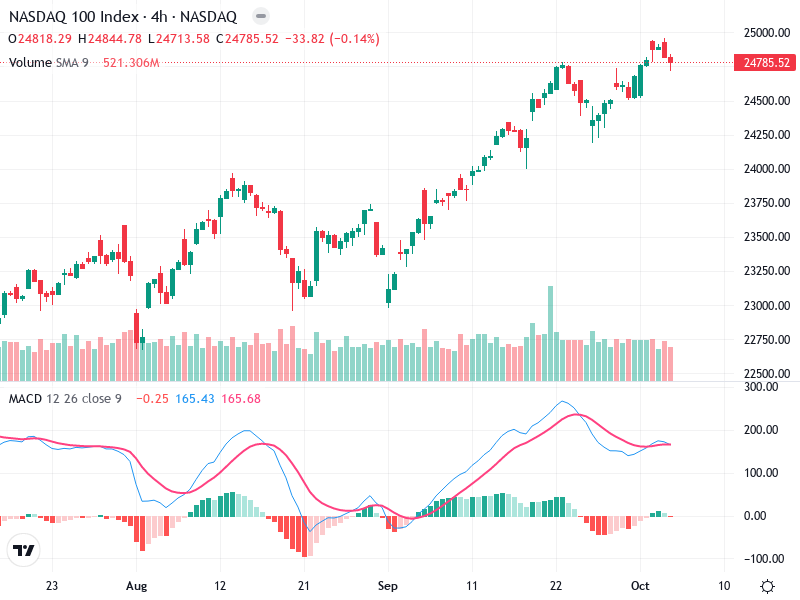
The chart illustrates the asset’s current trajectory, which is predominantly bullish. Observations suggest room for further
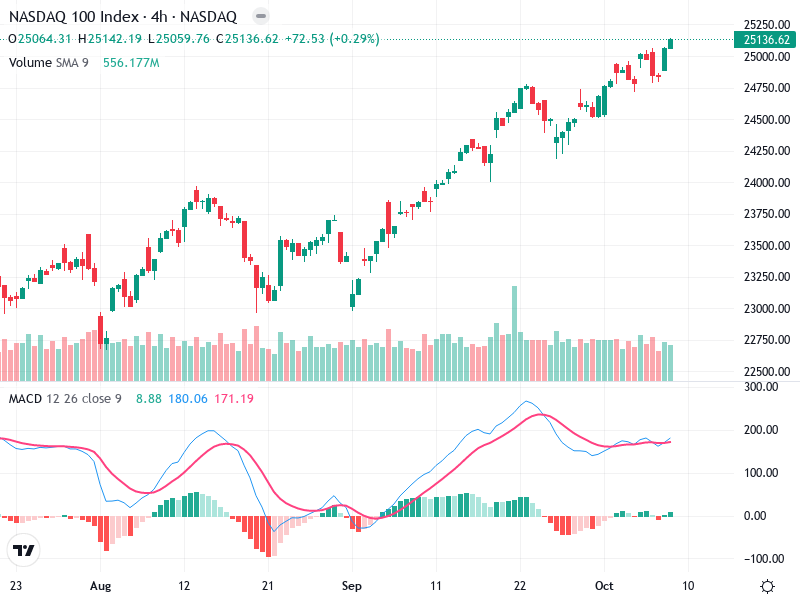
The chart indicates a positive trend in the asset’s price movements. Technical indicators suggest a continuation
The NASDAQ 100 Index has shown a bullish trend recently, with indicators suggesting a possible continuation
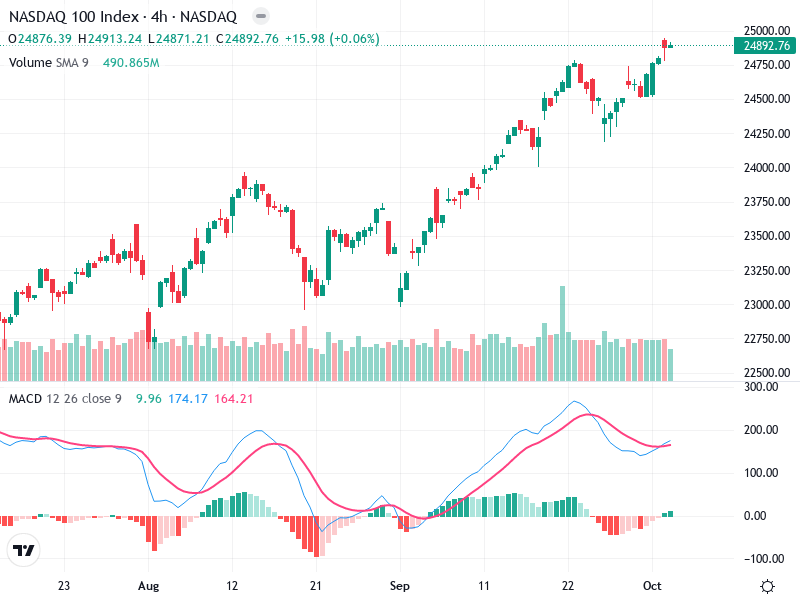
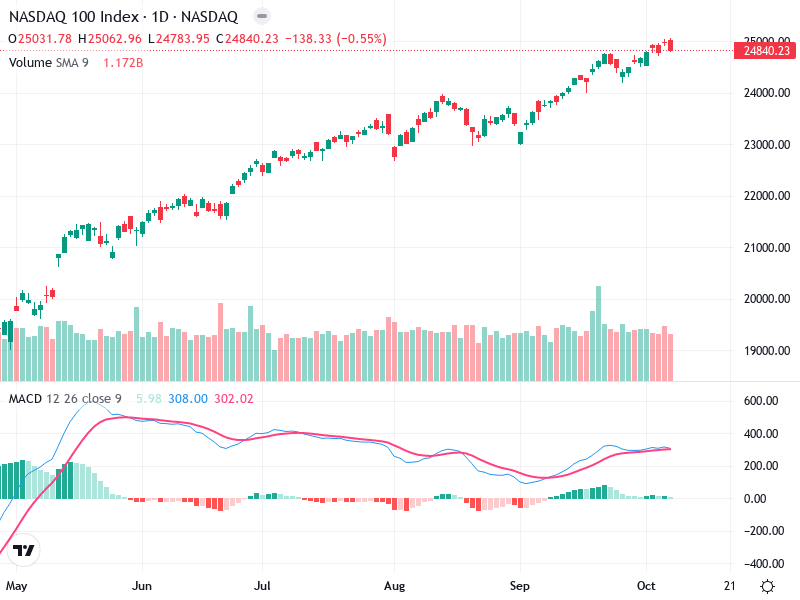
The asset chart shows a strong bullish trend with upward momentum. Key levels of support and
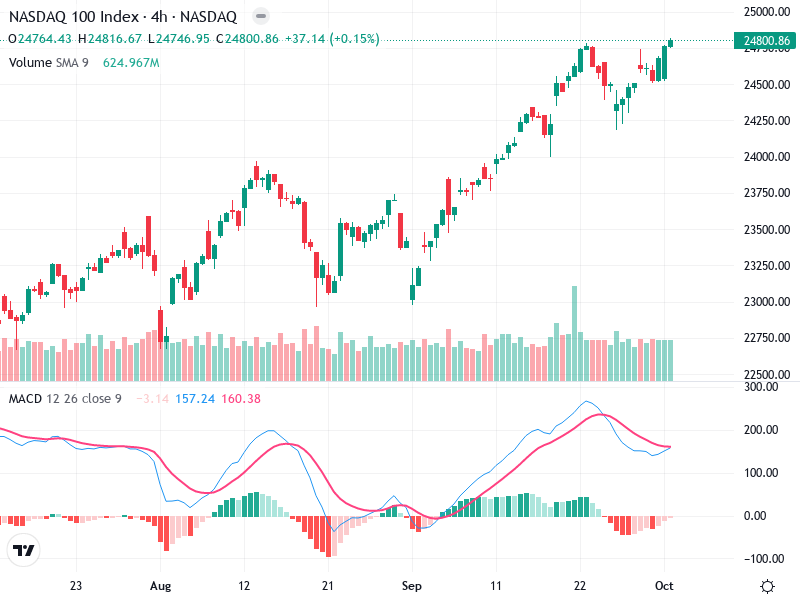
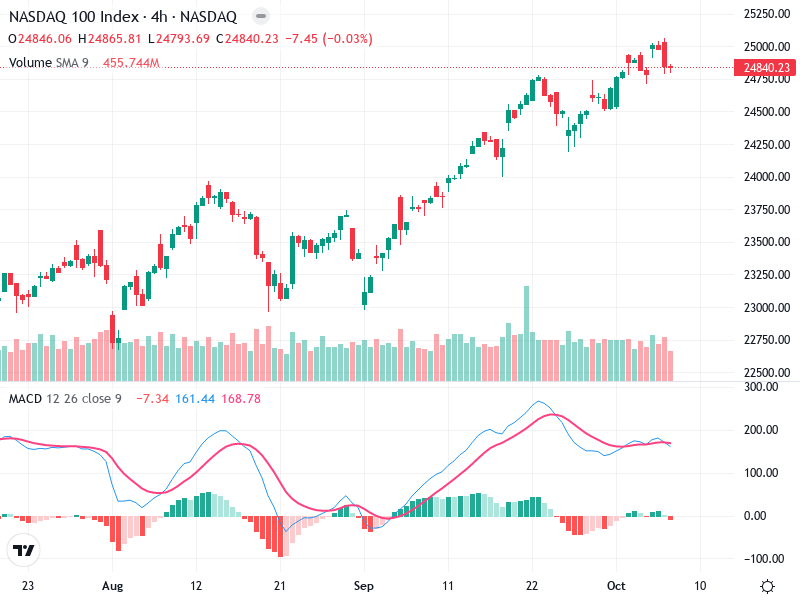
The NASDAQ 100 Index shows strong upward momentum on its 4-hour chart. Recent bullish patterns and
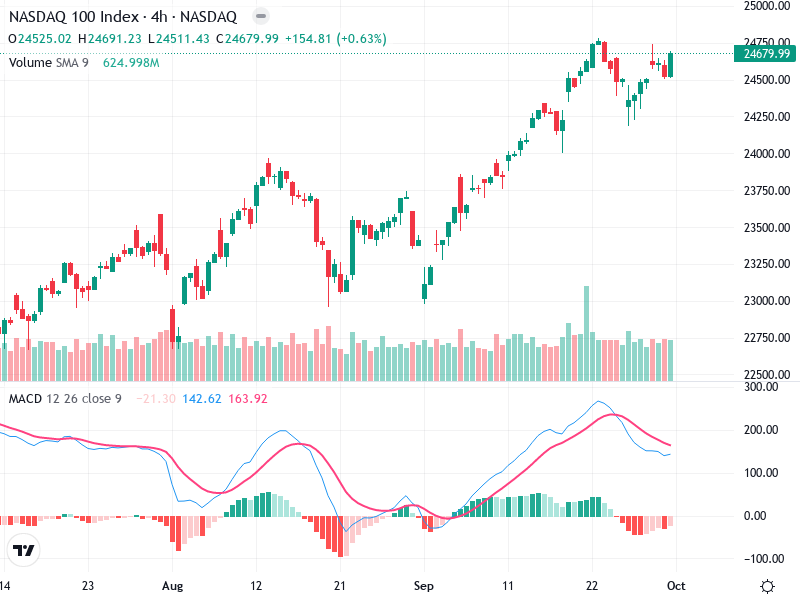
The asset is experiencing a strong upward trend, demonstrating consistent higher highs and higher lows. Recently,
This chart showcases a recent strong upward trend beginning in early September. There has been a
