NSDQ – Technical Analysis – 4h
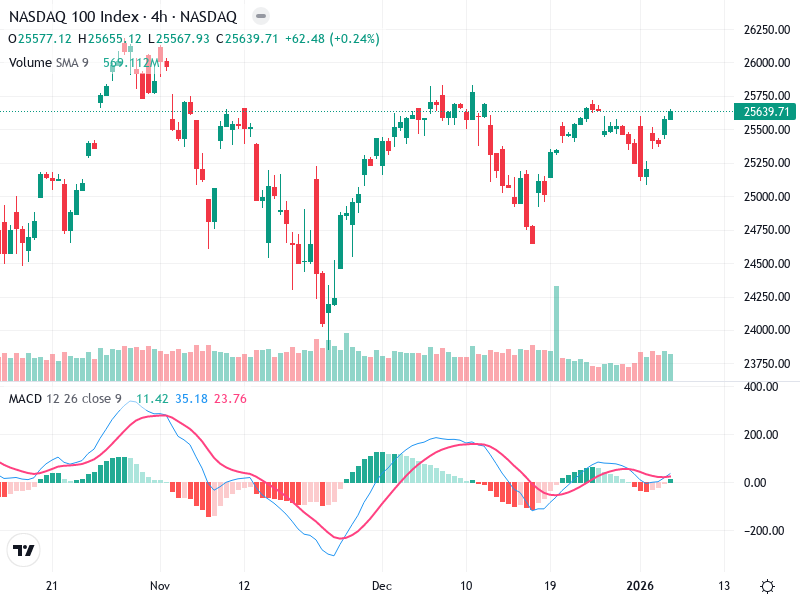
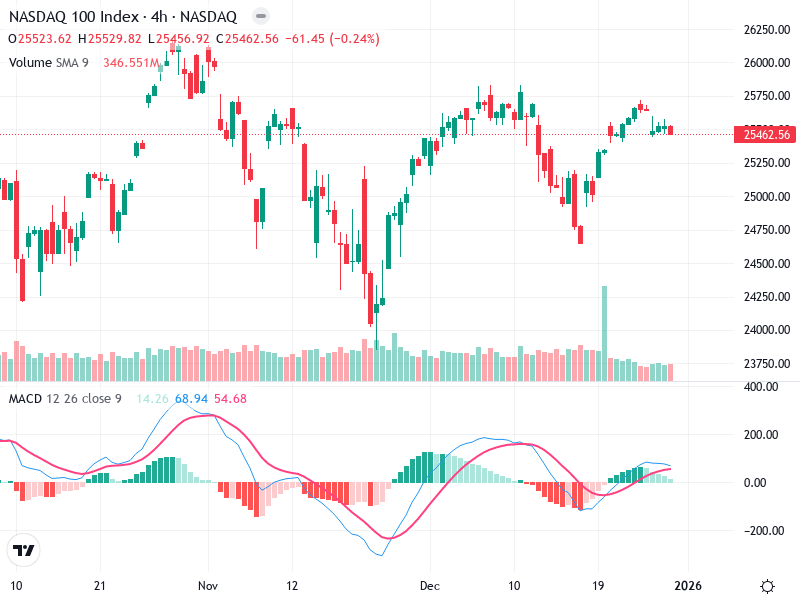
The chart for the asset displays a noticeable upward movement, driven by recent bullish momentum. Evidence
The chart for the asset displays a noticeable upward movement, driven by recent bullish momentum. Evidence
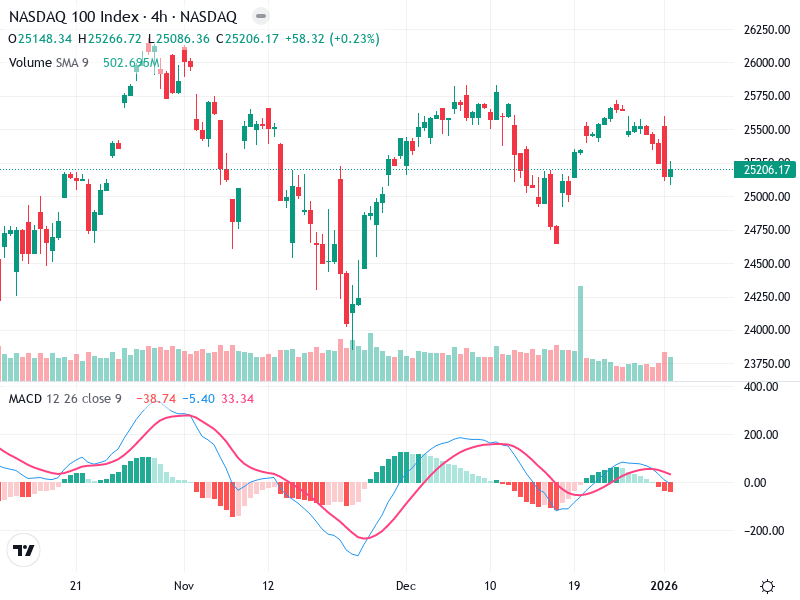
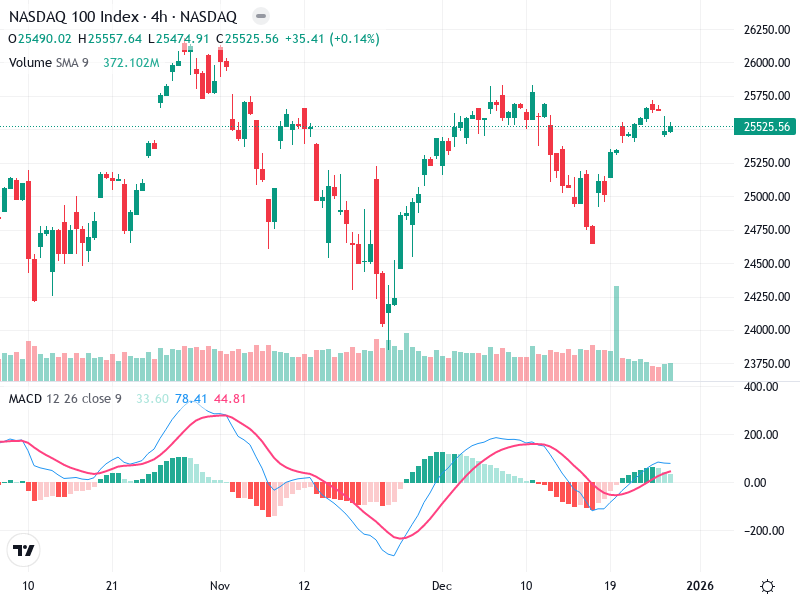
The asset’s chart reveals significant volatility in a predominantly sideways trend. Key levels at 24,500 and
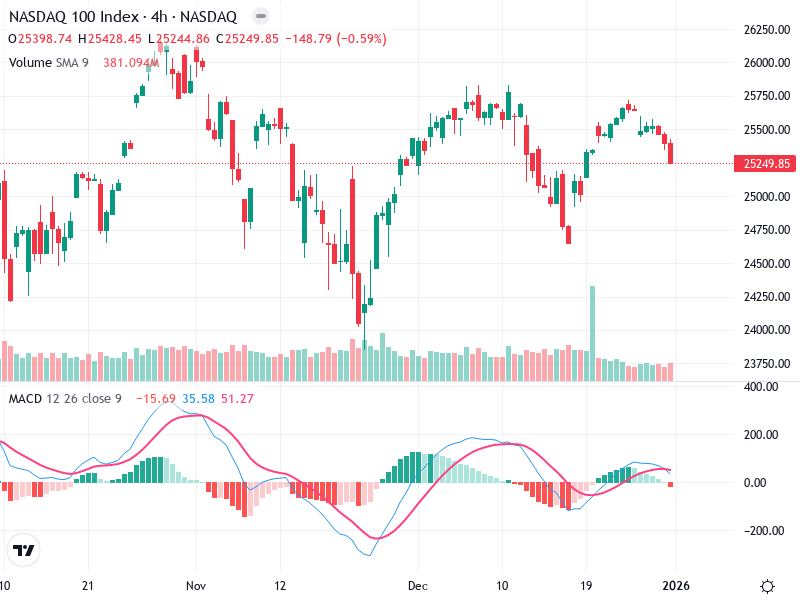
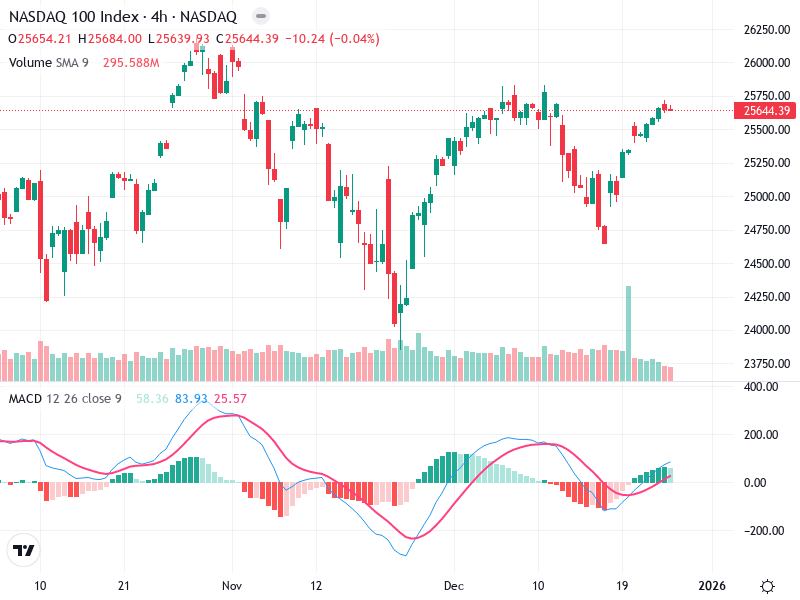
The NASDAQ 100 chart is at a critical juncture. Indicators suggest potential bullish reversal. Key resistance

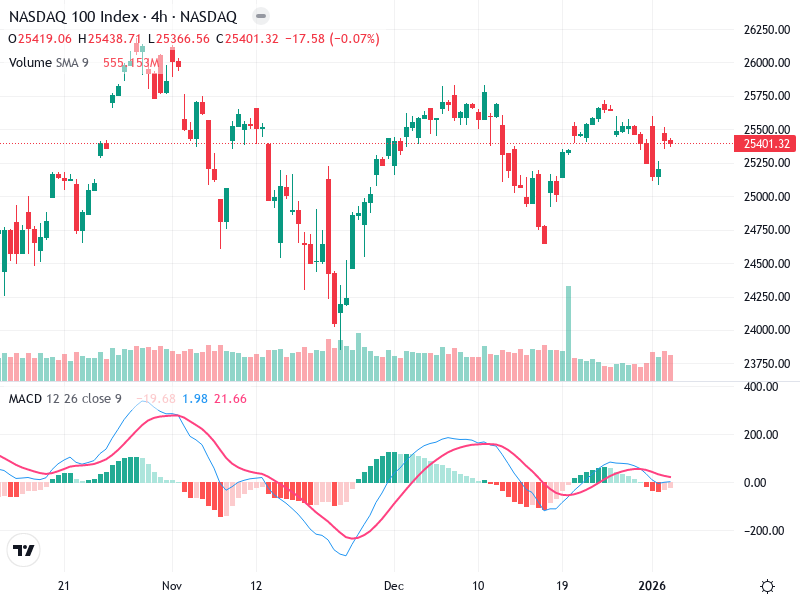
The chart indicates a bearish outlook for the asset. Persistent downtrends and declining MACD signals suggest
The NASDAQ 100 Index is exhibiting a bearish trend on the 4-hour chart, with increasing selling
The asset is showcasing a significant technical pattern with noteworthy movements. Recent trends suggest a change
The chart displays a recovery from a previous downtrend, indicating a shift in momentum. Recent patterns
This analysis provides an overview of the current technical setup for the asset. The chart reveals

The NASDAQ 100 Index chart reveals a notable upward trend, supported by strong technical indicators. Key
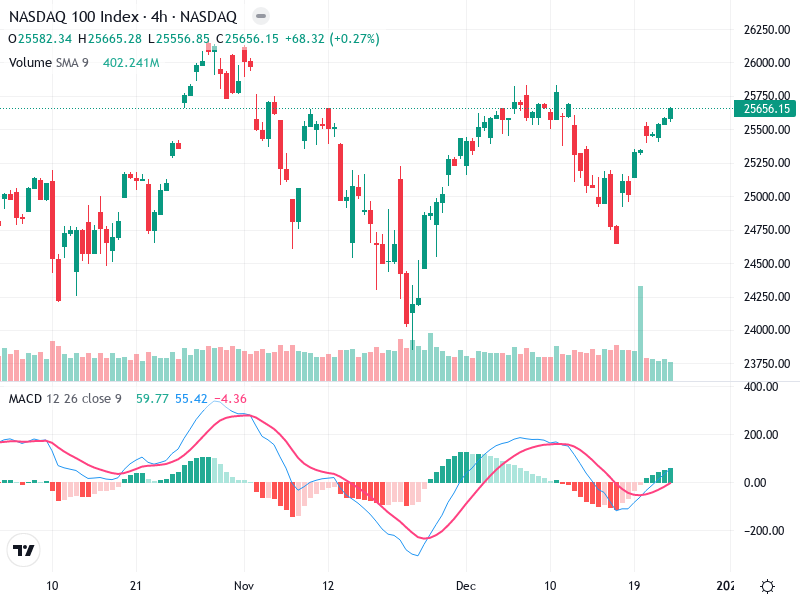
The NASDAQ 100 Index shows significant movement as it recovers from a recent pullback. The chart
