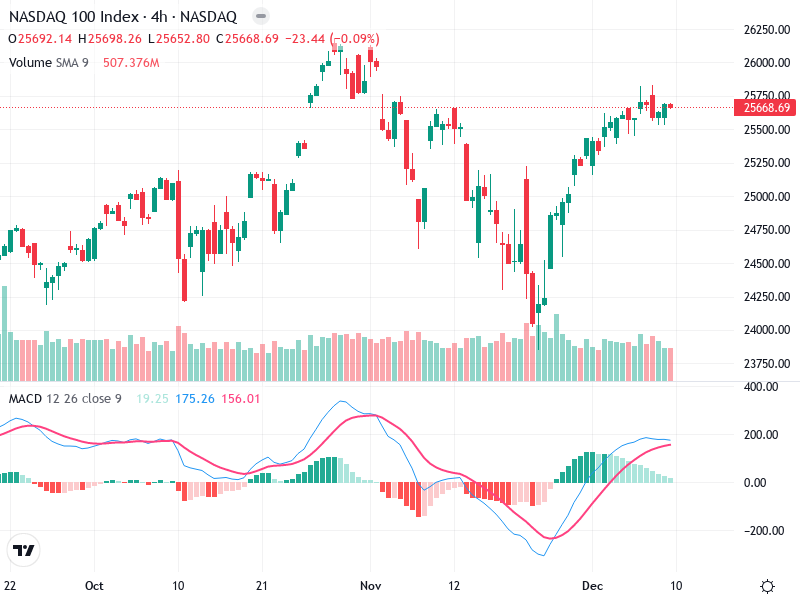
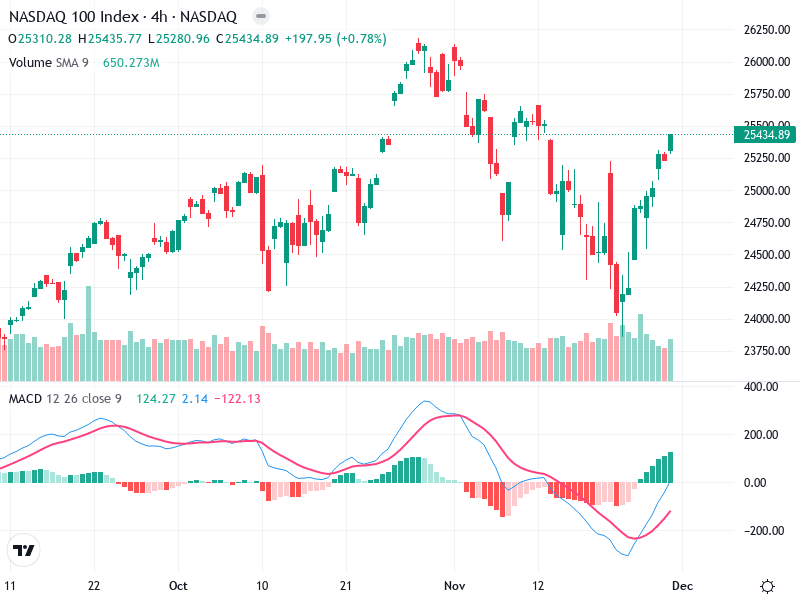
NSDQ – Technical Analysis – 4h
The NASDAQ 100 Index is displaying a mix of consolidation and potential breakout signals on its
The NASDAQ 100 Index is displaying a mix of consolidation and potential breakout signals on its
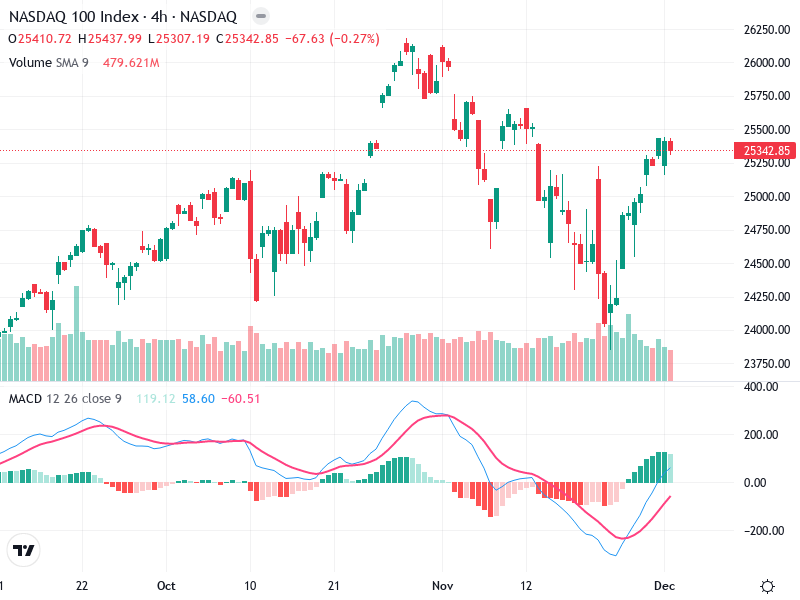
The chart showcases recent movements with a notable trend. Indicators reflect a potential shift in market
This technical analysis provides insights into the Asset’s current market condition. The Asset is currently displaying

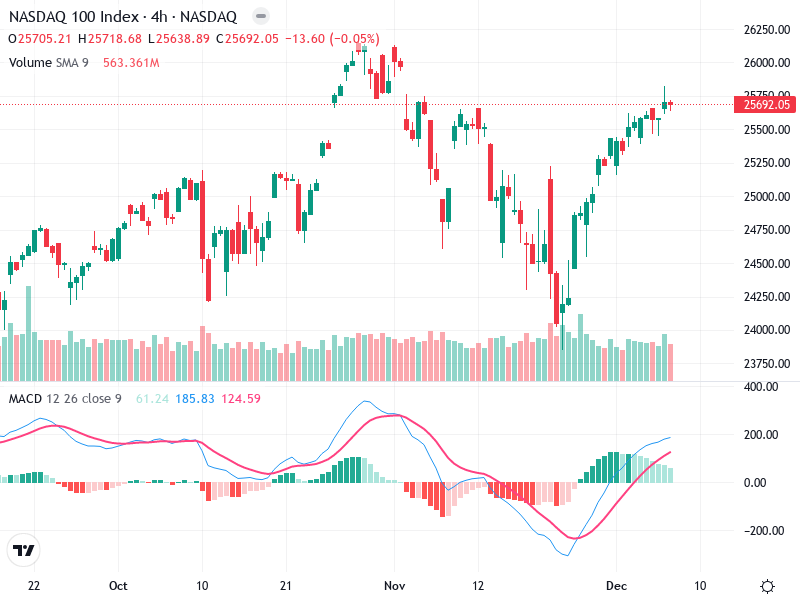
The chart presents a clear bullish trend for the asset, characterized by strong green candlesticks and
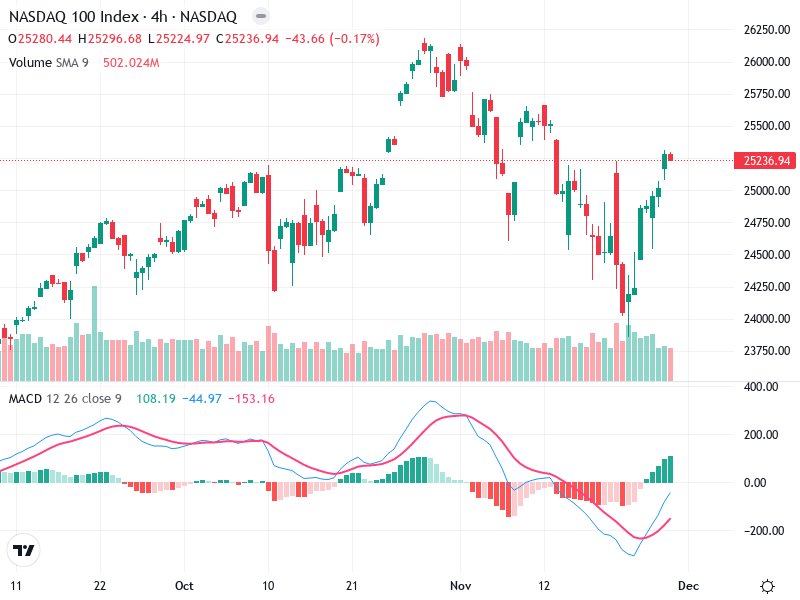
The analysis of shows a potential shift in trends with significant indicators pointing towards a bullish
The chart of reveals a developing bullish trend, supported by consistent buying pressure. There is an


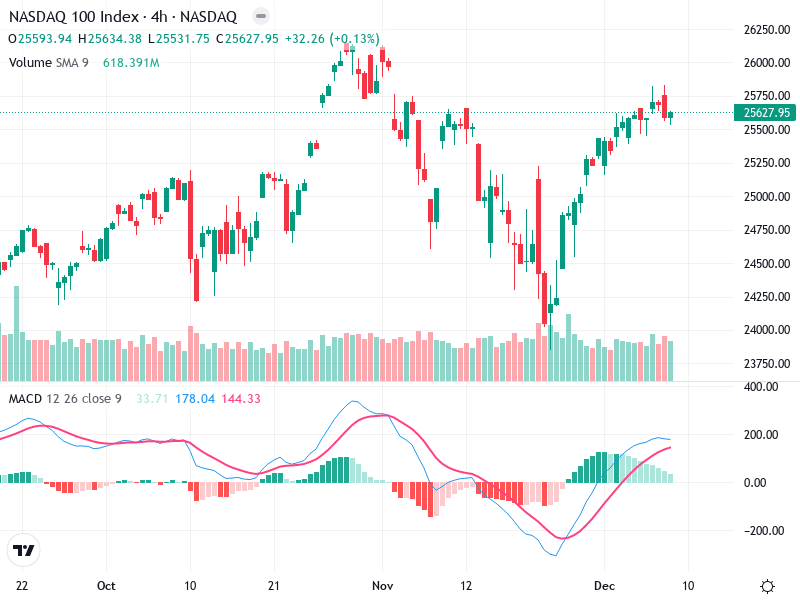
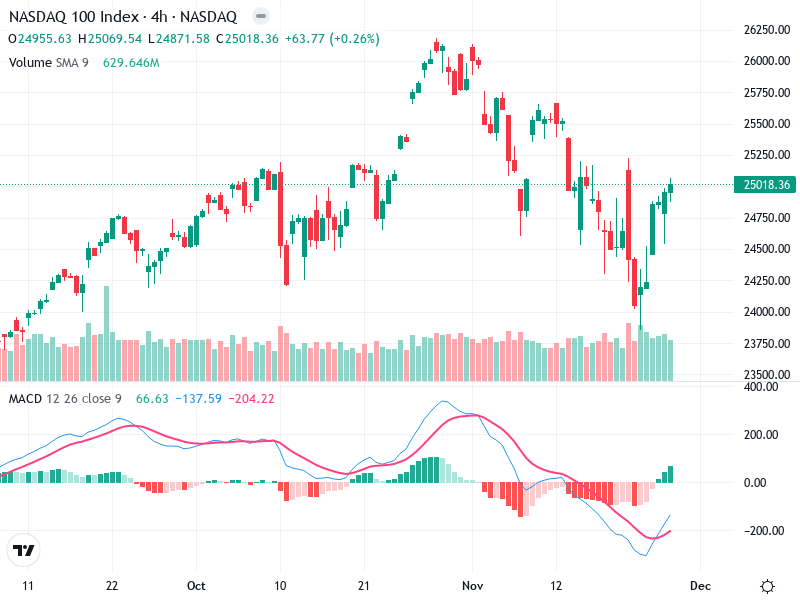
The NASDAQ 100 chart shows a recovery from its recent downtrend. Key indicators suggest a potential
The analysis of the chart highlights an emerging bullish trend. Recent price actions suggest a recovery
The NASDAQ 100 index chart shows signs of a recovery as it transitions from a recent
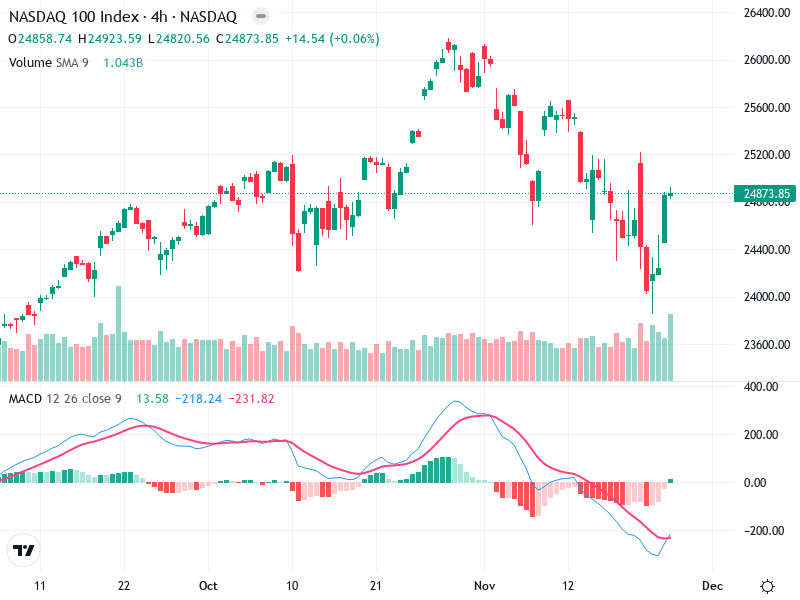
The chart provides a detailed examination of the current trends and technical indicators for . With
