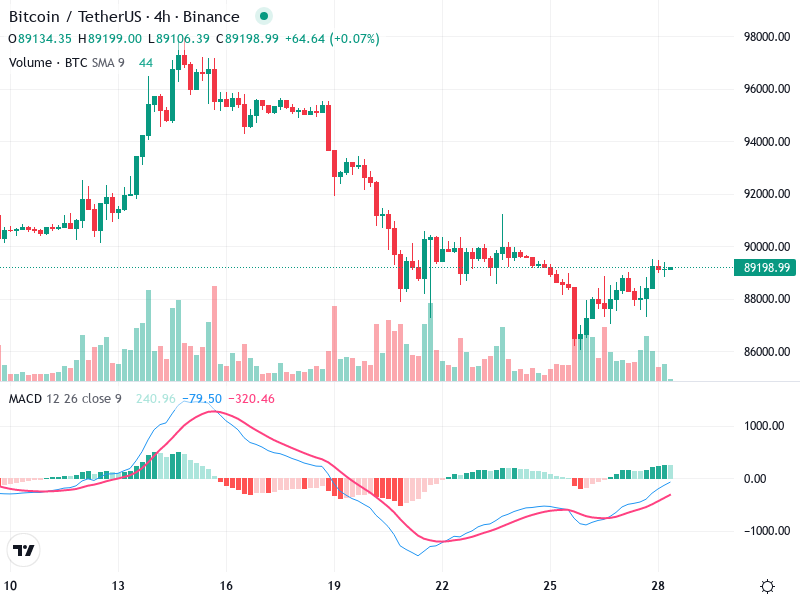
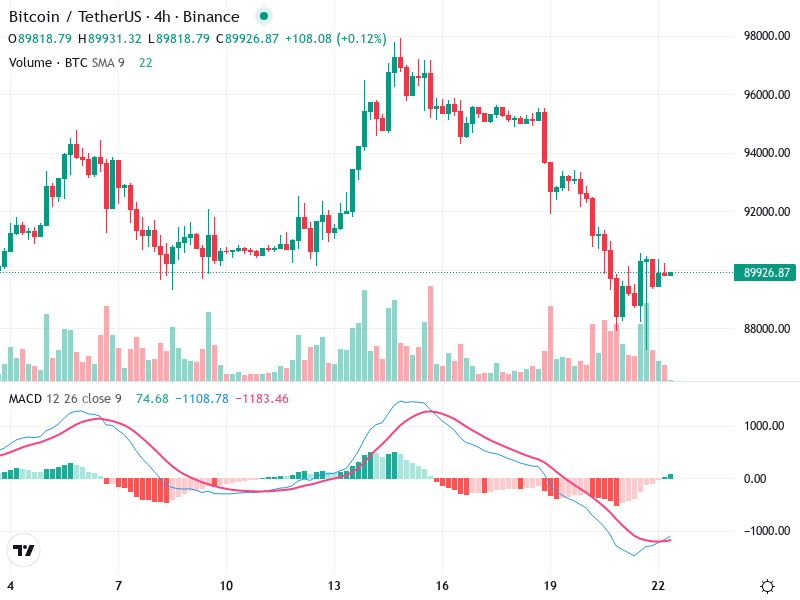
BTC/USD – Technical Analysis – 4h
The chart showcases the recent price movements of the asset, indicating potential pivotal zones for traders.
The chart showcases the recent price movements of the asset, indicating potential pivotal zones for traders.
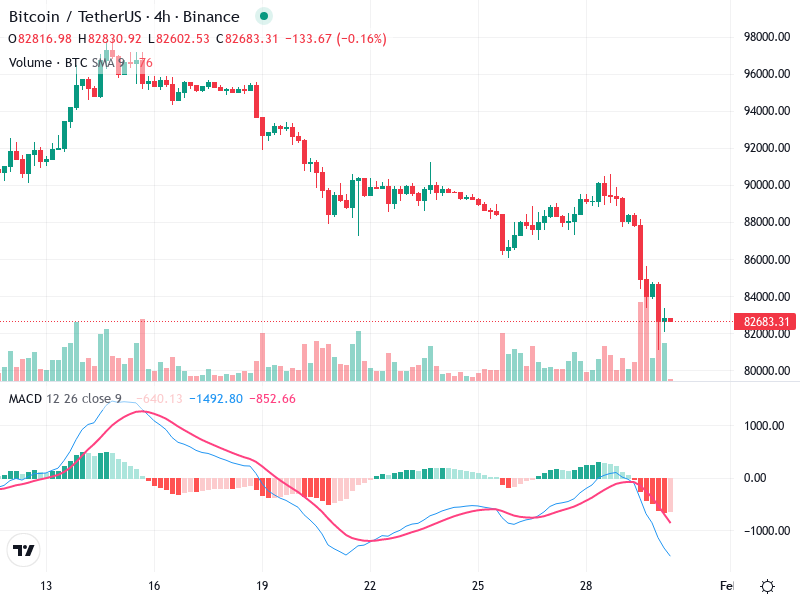
The asset is currently exhibiting bearish tendencies based on recent chart patterns. Detailed examination of specific
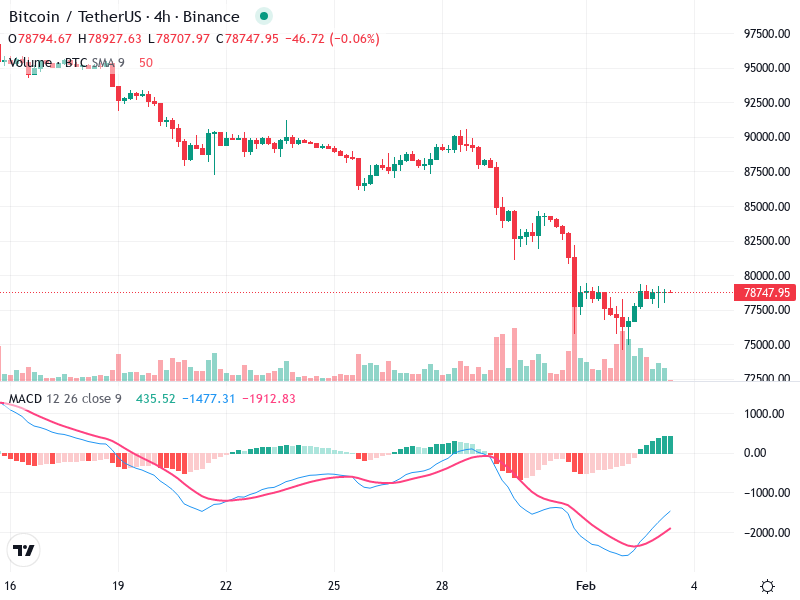
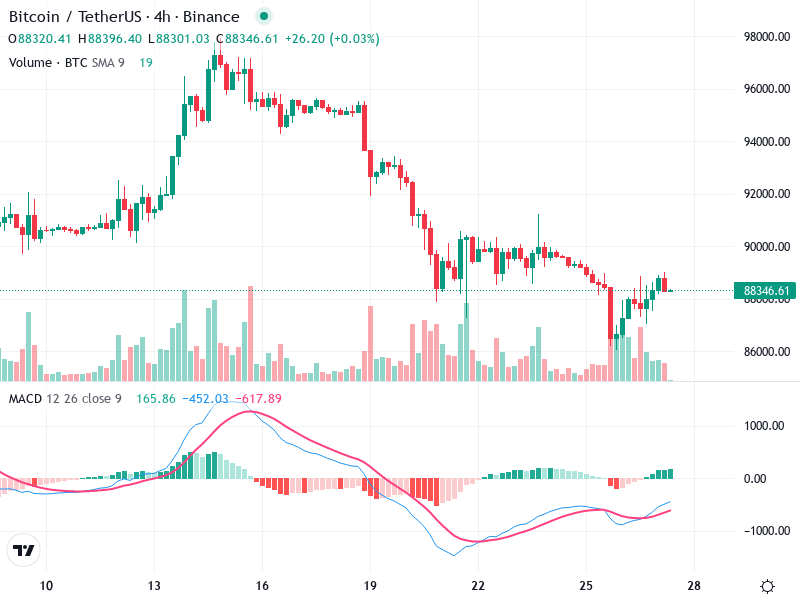
The Bitcoin/TetherUS chart shows a bearish trend with key technical indicators pointing to potential continued decline.
The Bitcoin/TetherUS 4-hour chart showcases significant bearish momentum with potential key support and resistance levels identified.
This chart shows the technical analysis of the financial asset, indicating a potential shift in market
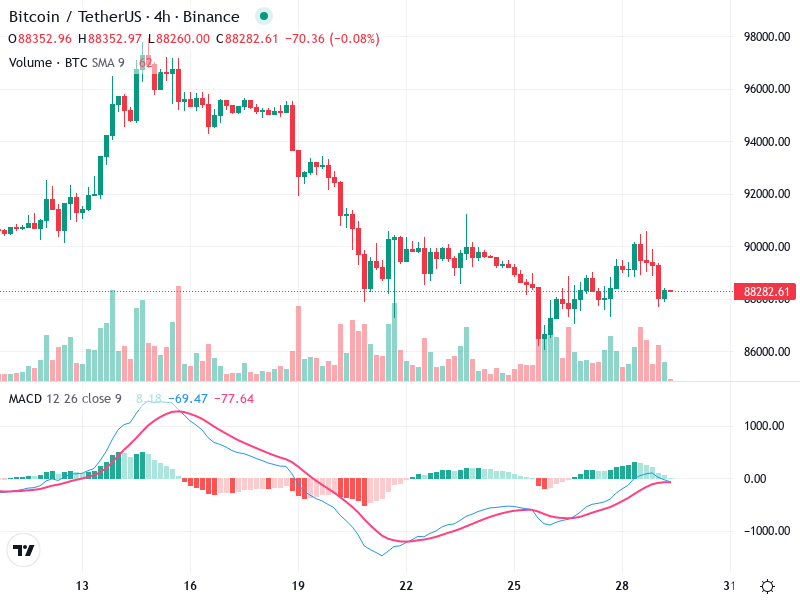
The chart for reveals intriguing movements over recent periods. With observed potential reversals and resistance level
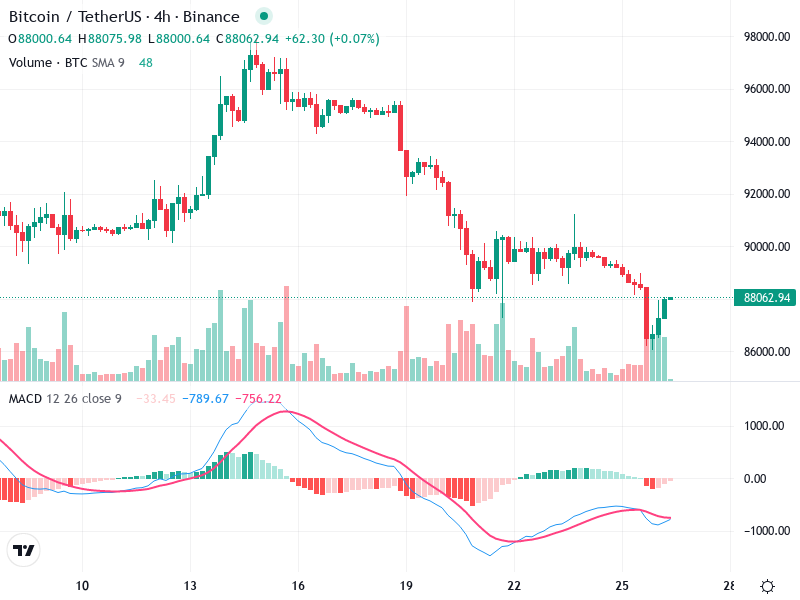
The chart is showing potential shifts in market sentiment. Recent technical indicators are signaling a possible
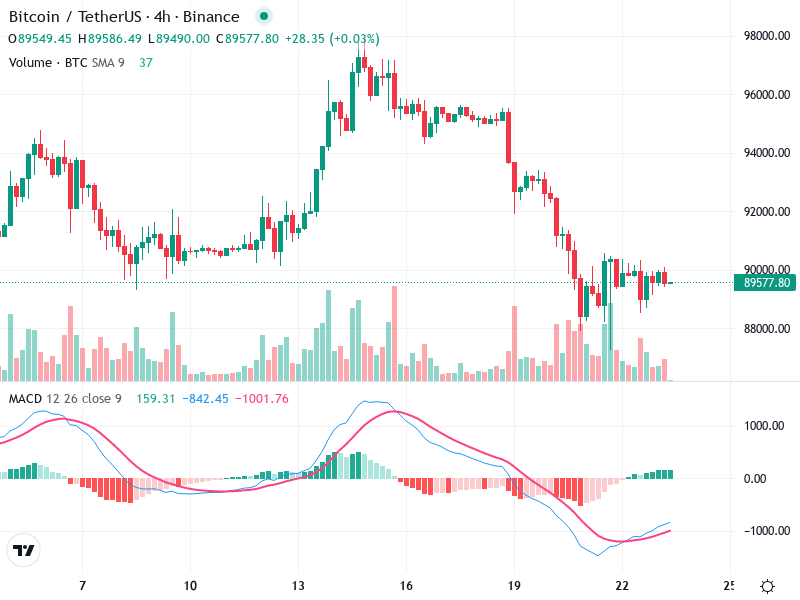
The chart currently shows significant levels of support and resistance. Moving between the key levels suggests
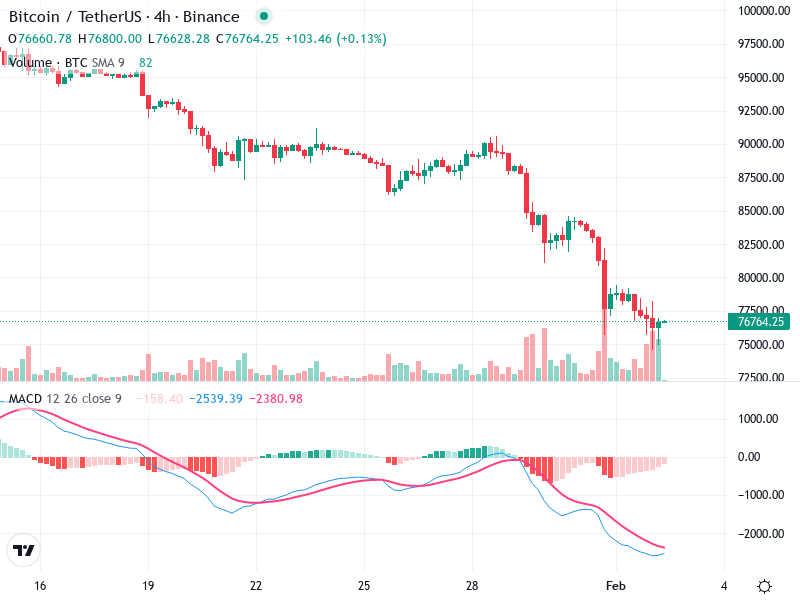
The BTC/USDT 4H chart shows fascinating movements indicating potential changes. The asset demonstrates signs of a
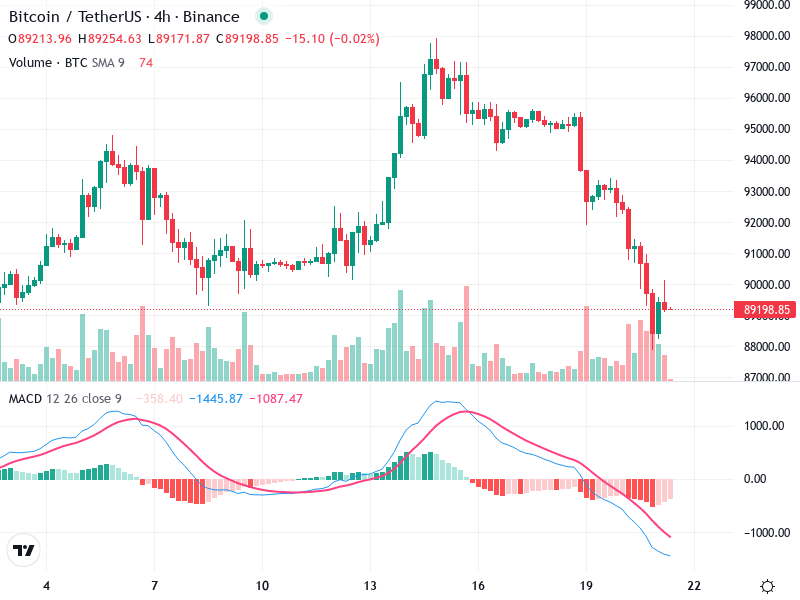
The BTC/USDT chart reveals a strong bearish trend. Recent market movements show lower highs and lows,

