BTC/USD – Technical Analysis – 4h
The chart highlights significant movements for the asset. Recent trends suggest a notable shift in sentiment.
The chart highlights significant movements for the asset. Recent trends suggest a notable shift in sentiment.
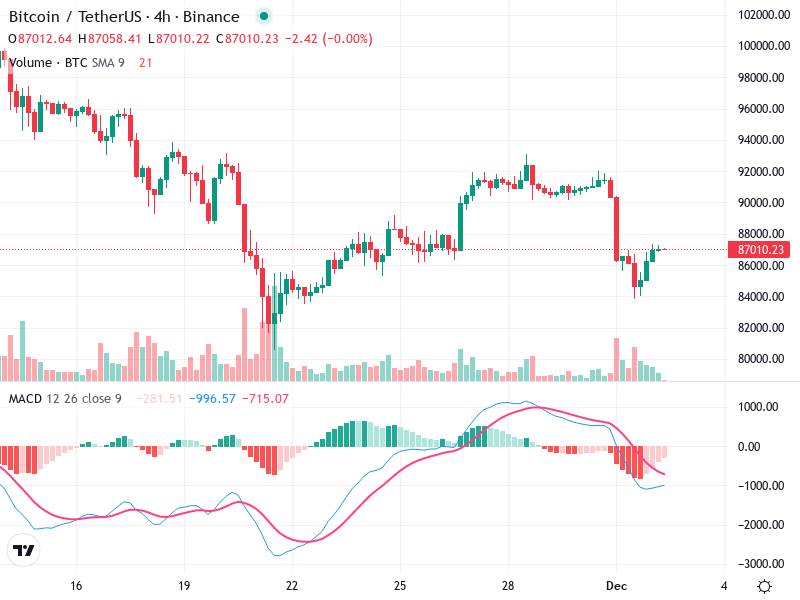
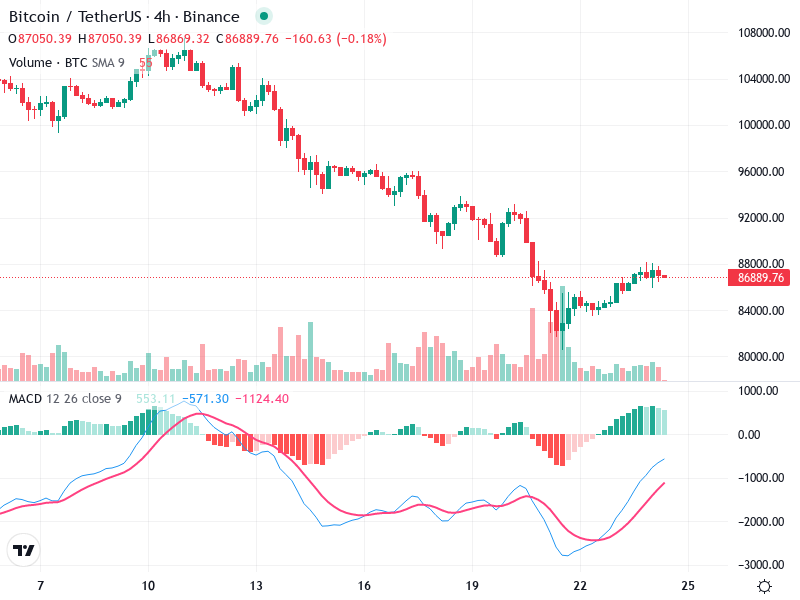
The market asset recently displayed strong bearish indicators, with significant sell-offs. However, there are initial signs
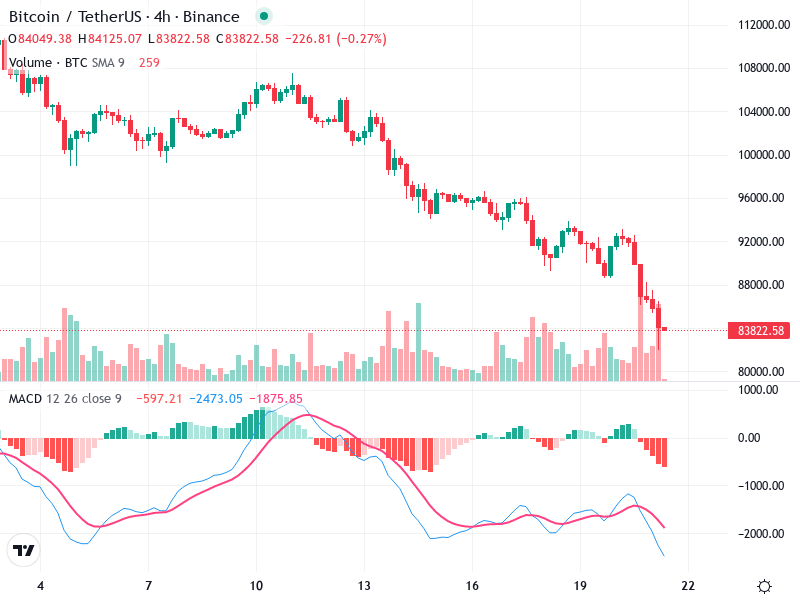
The chart shows a pronounced decline, with significant bearish indicators. The market sentiment suggests a cautious
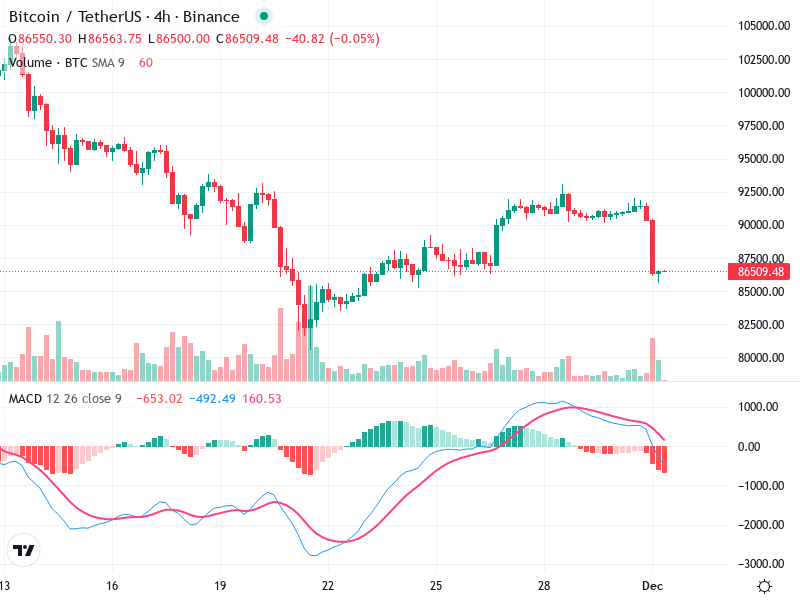
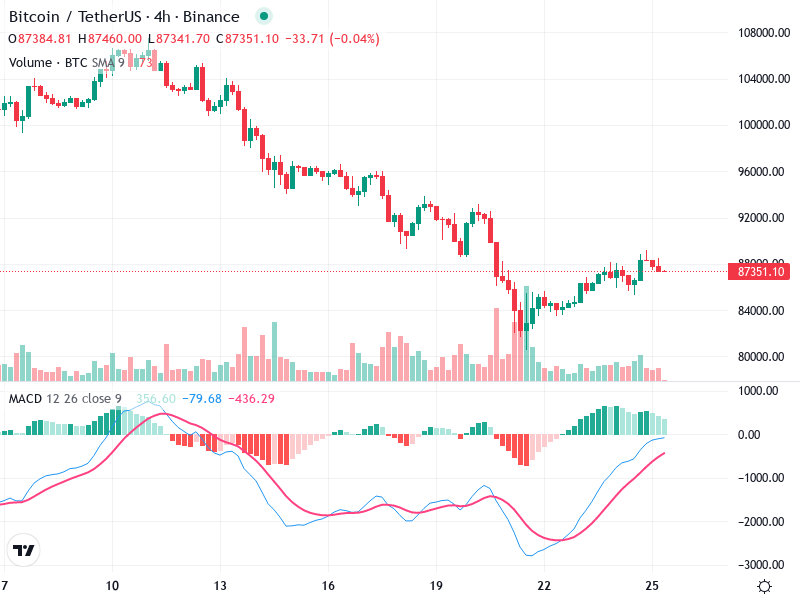
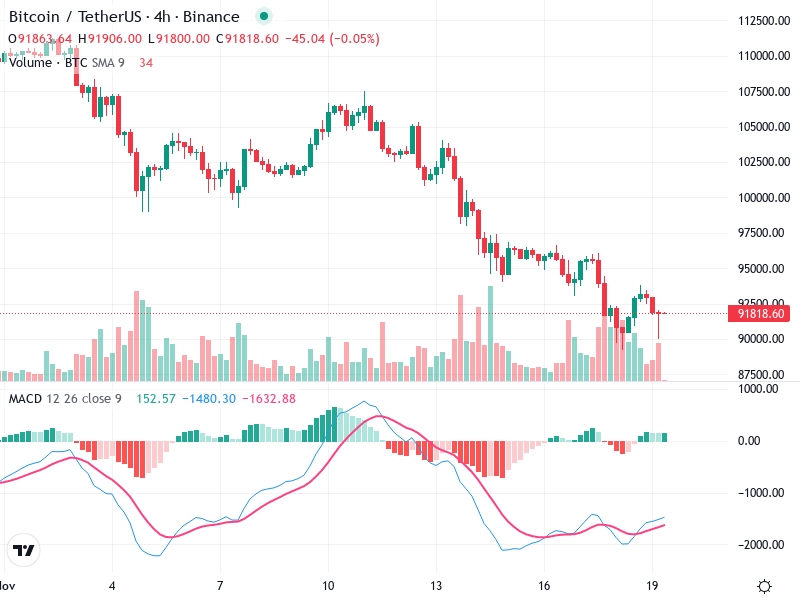
The chart reflects a transition phase with a halt in the previous downtrend, suggesting potential for
The asset has shown a recent decline, transitioning into a phase of consolidation. This indicates a
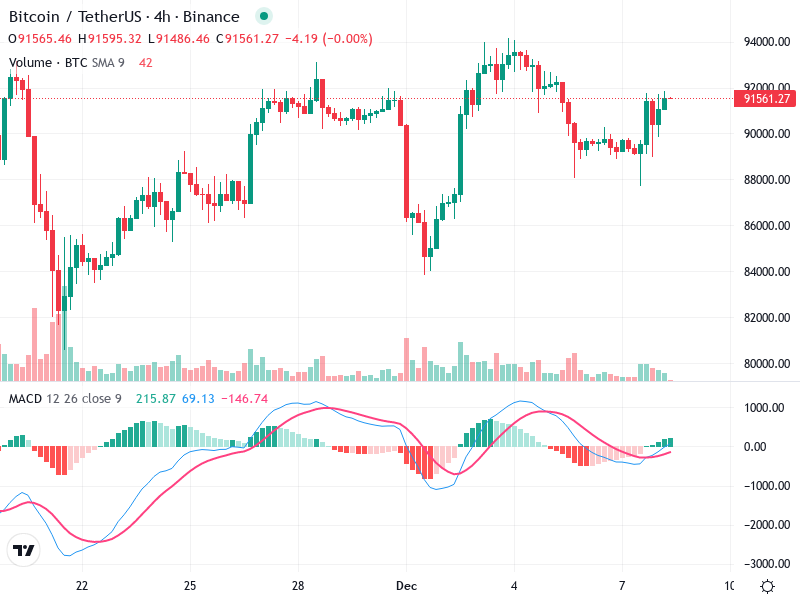
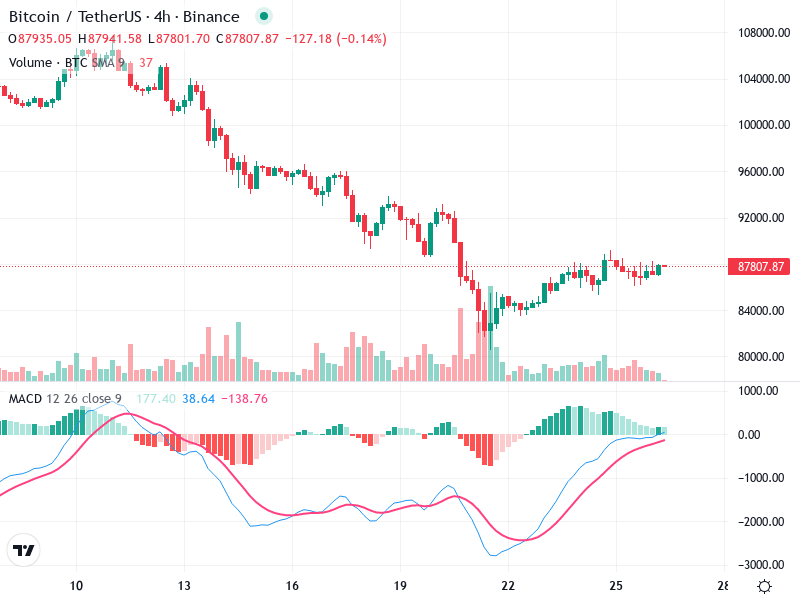
The Bitcoin chart illustrates a transition from a previous strong downtrend to a recent phase of
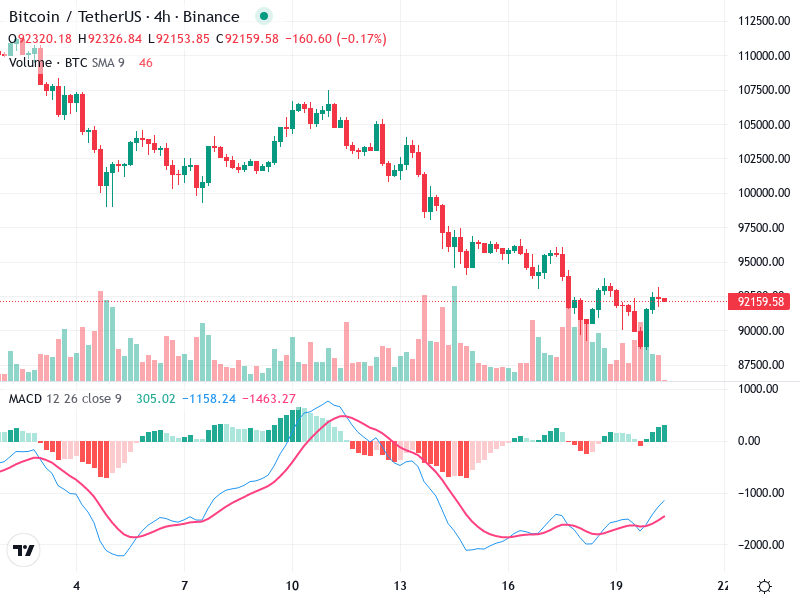
The Bitcoin/TetherUS chart reveals a recent bullish crossover indicated by the MACD, suggesting potential upward momentum.

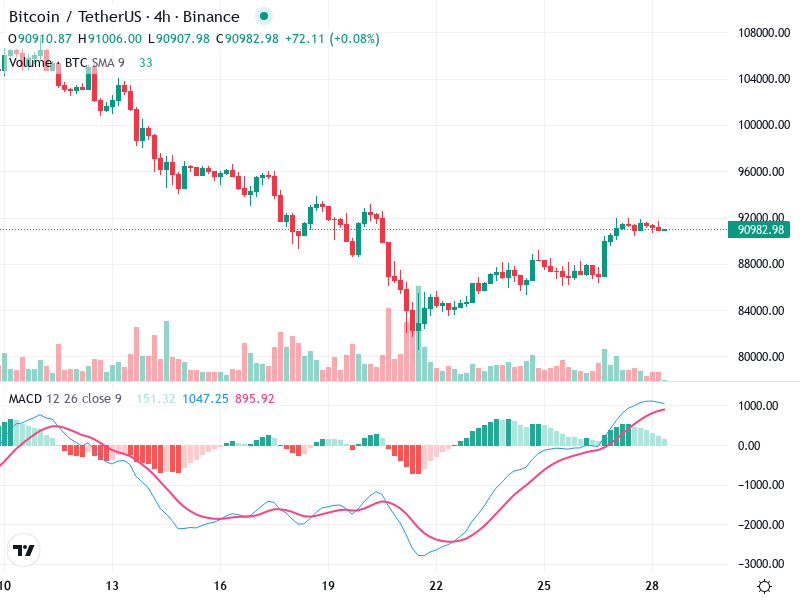
The current chart of Bitcoin suggests a notable bearish trend primarily, with periodic small green candles
This technical analysis explores the current market conditions of Bitcoin/TetherUS. Recent chart patterns suggest a potential
The Bitcoin/TetherUS 4-hour chart exhibits a bearish trend with prominent selling pressure. Significant candlestick patterns indicate
