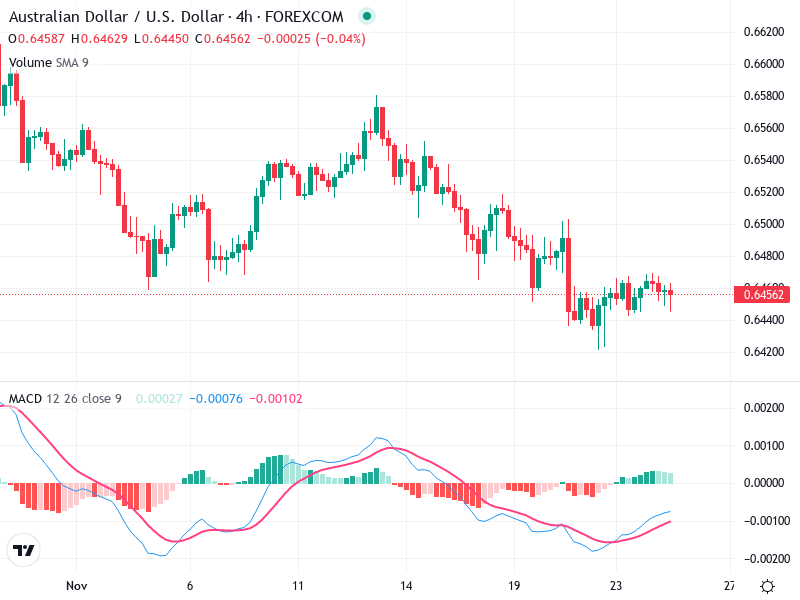
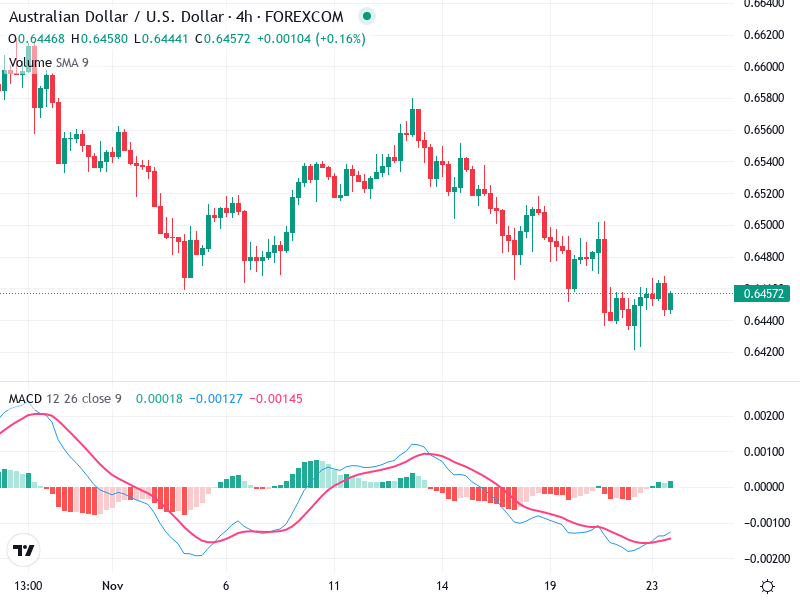
AUD/USD – Technical Analysis – 4h
The AUD/USD 4-hour chart is currently in a consolidation phase. The asset shows a transition from
The AUD/USD 4-hour chart is currently in a consolidation phase. The asset shows a transition from
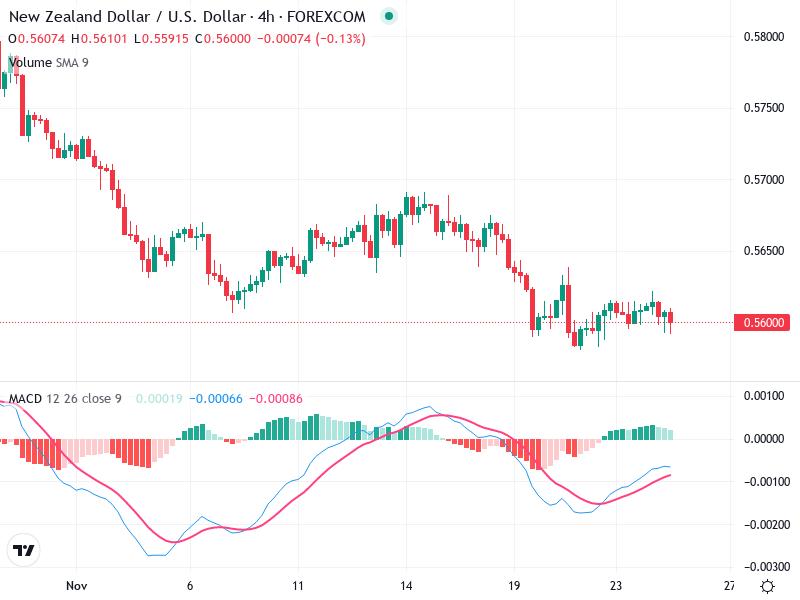
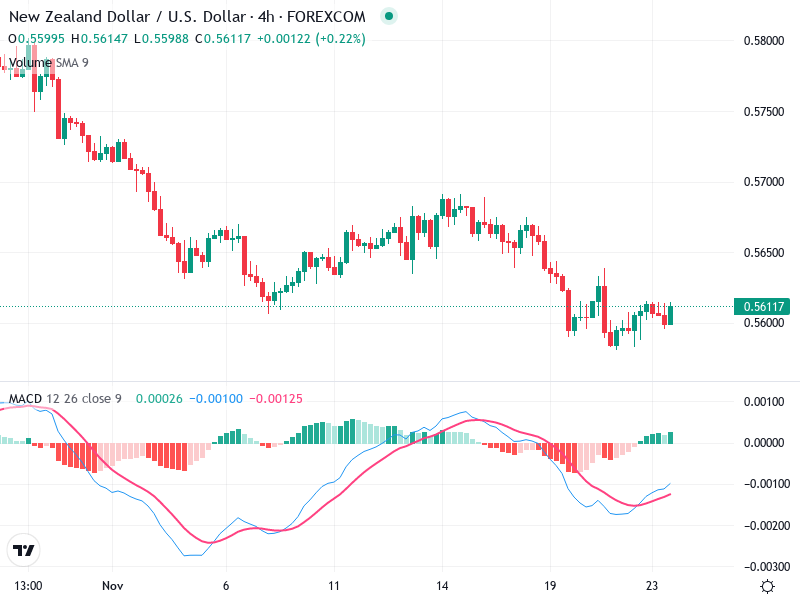
The NZD/USD 4-hour chart shows a mix of market sentiments. Recently, there has been a sideways
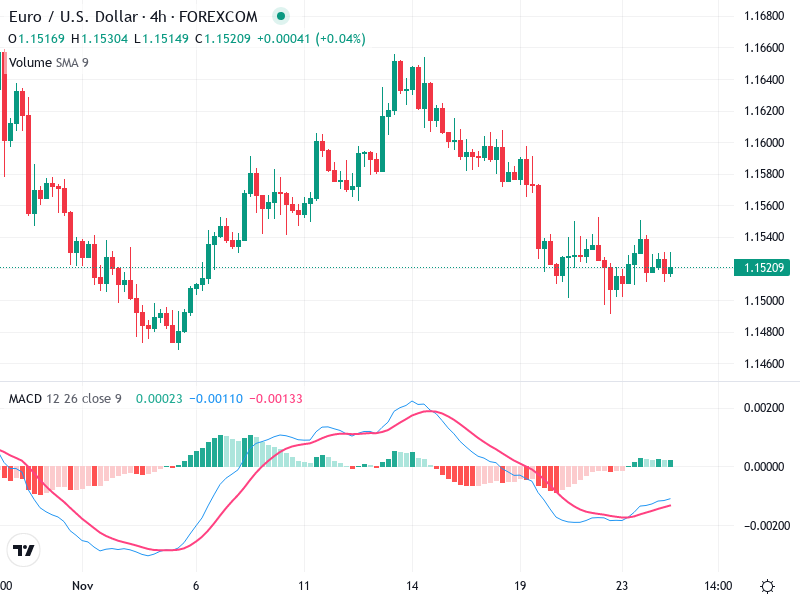
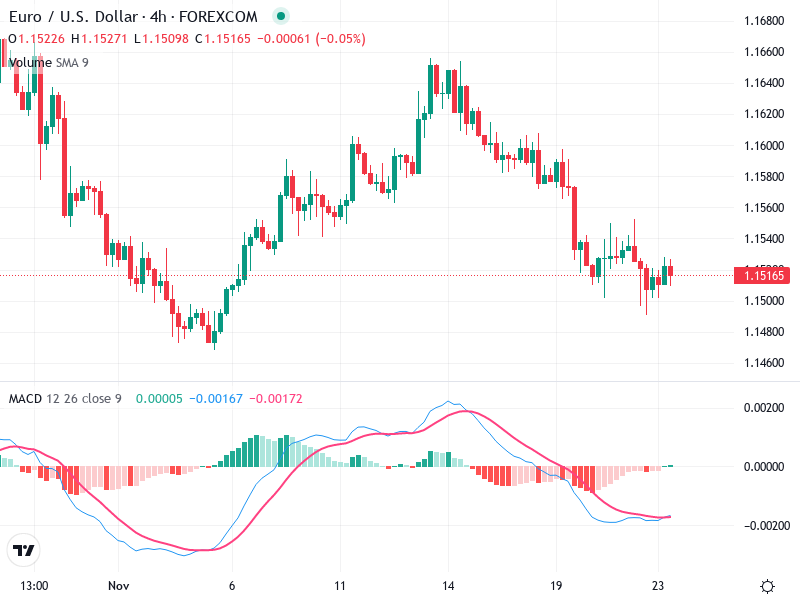
The chart depicts a recent bearish trend followed by a period of consolidation. The candlestick patterns
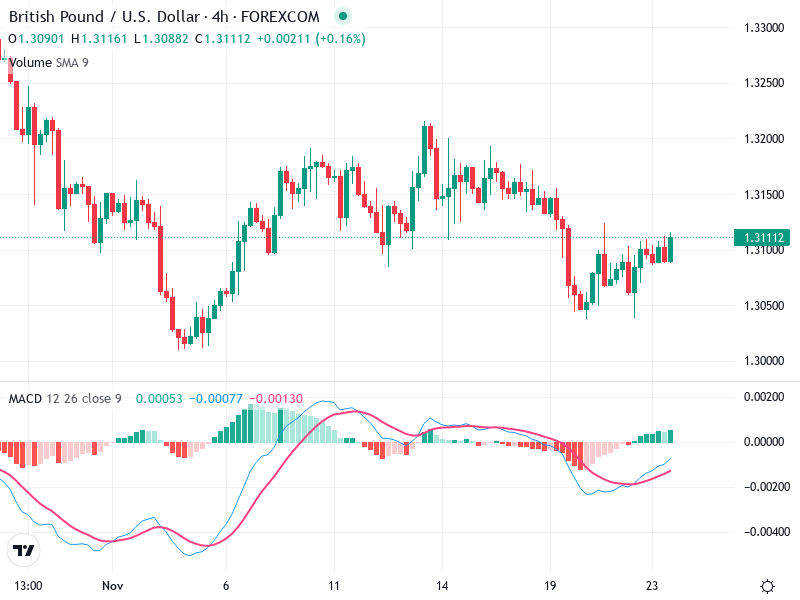
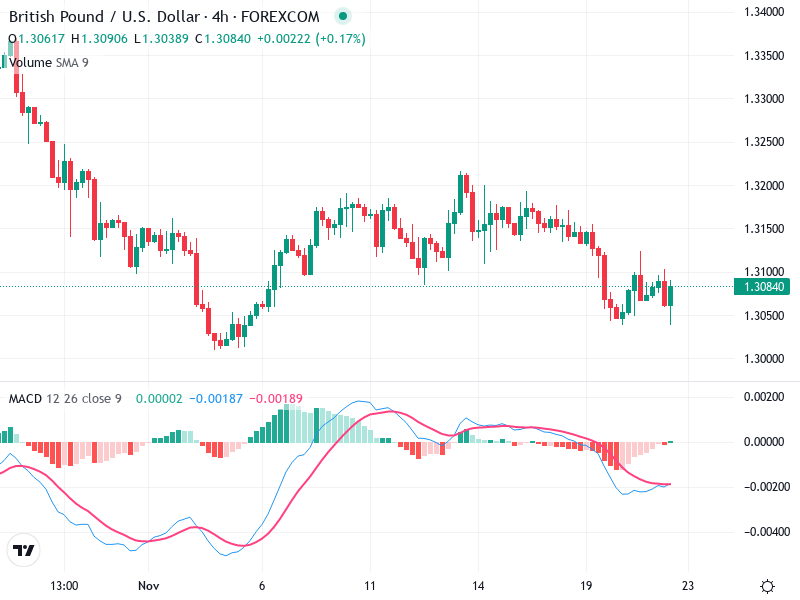
The GBP/USD chart reveals significant technical indicators offering insights into potential price movements. Currently, the market
The chart showcases with current technical indicators highlighting mixed signals. Overall sentiment reflects cautious optimism with
The chart analysis indicates a strategic consolidation phase for the asset. The asset appears to be
The chart shows significant trends and patterns for the asset. It initially shows a bullish trend
The asset exhibits a predominantly sideways to slightly bearish trend with recent consolidation around important levels.
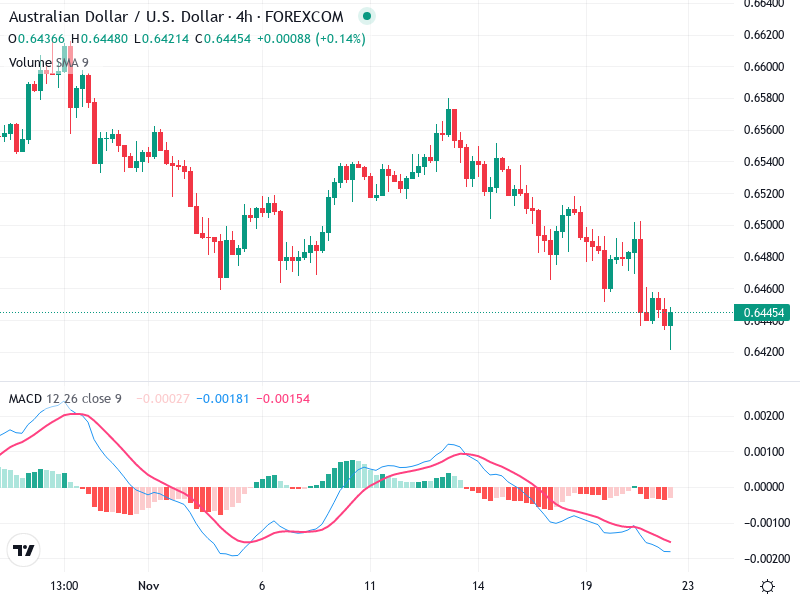
The AUD/USD 4H chart reveals a bearish sentiment influenced by consistent downward price action and negative
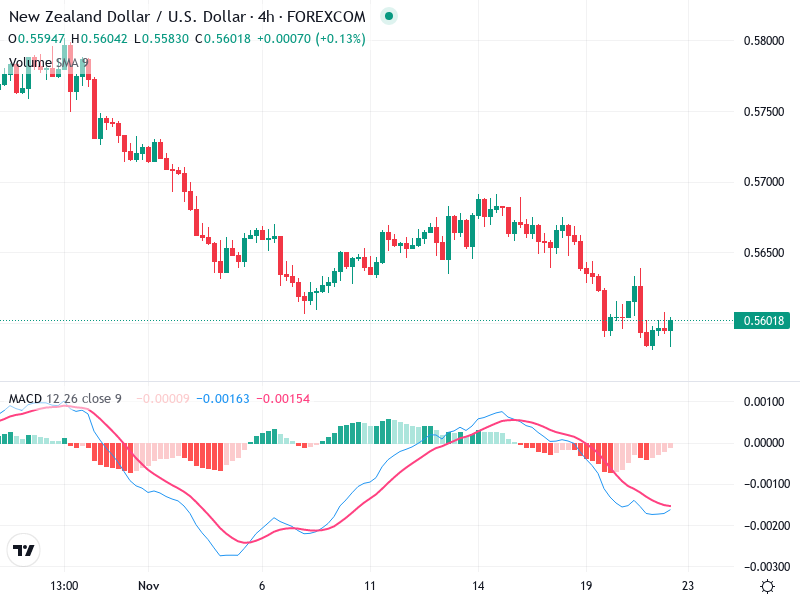
The NZD/USD chart is experiencing a consolidation phase after a bearish trend. The presence of significant
