NSDQ – Technical Analysis – 4h
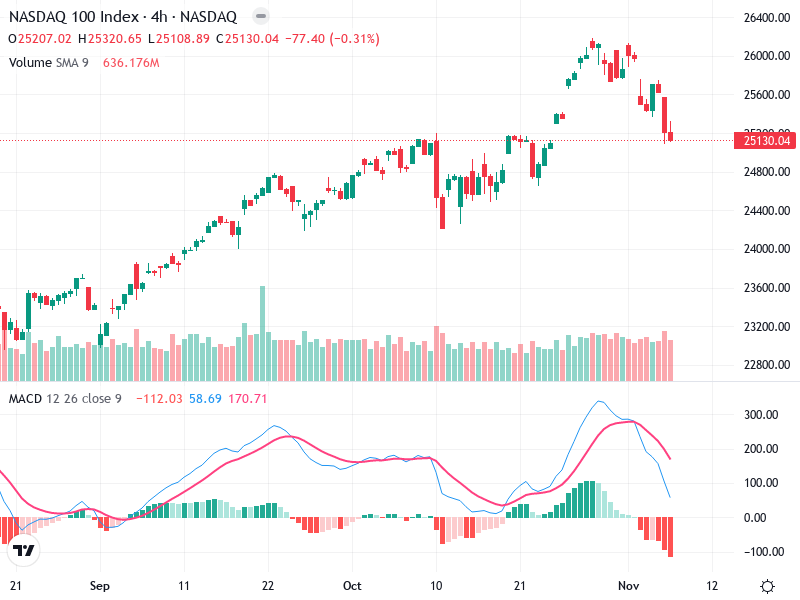
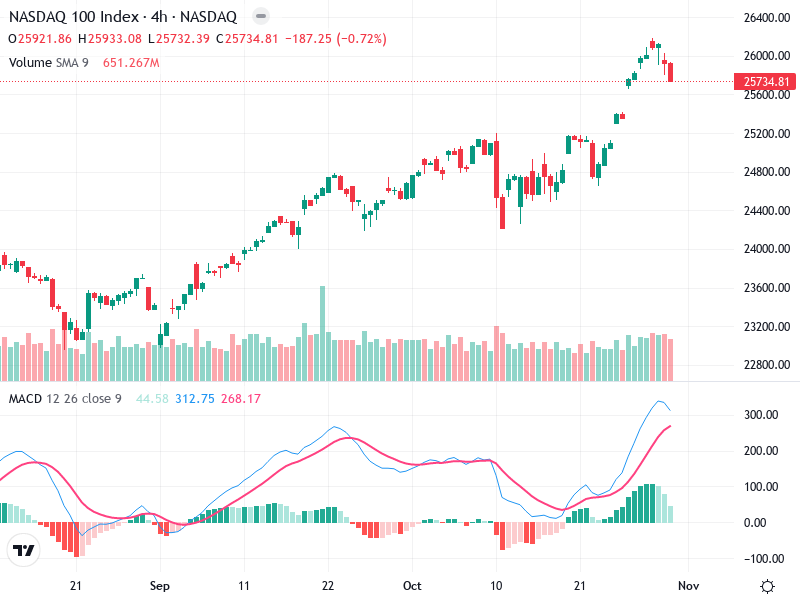
The NASDAQ 100 chart currently reflects a bearish sentiment with recent downturns. The asset has seen
The NASDAQ 100 chart currently reflects a bearish sentiment with recent downturns. The asset has seen
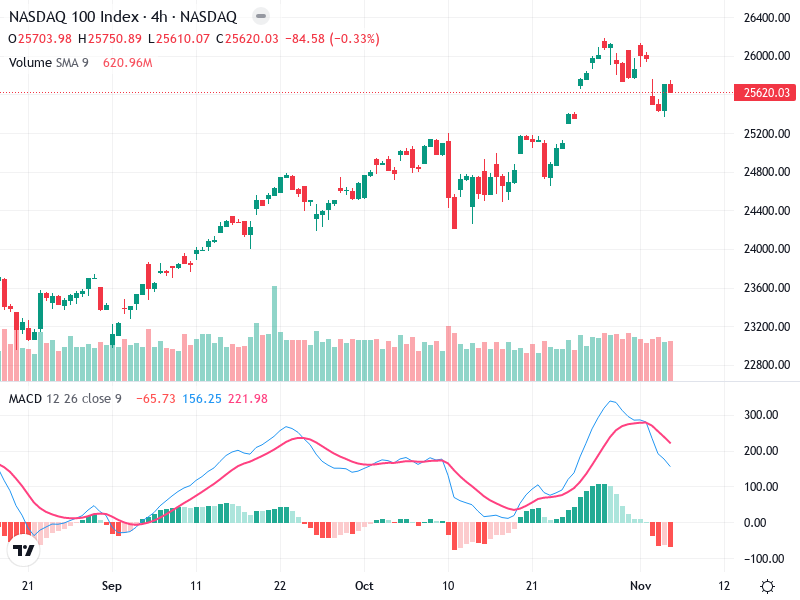
The chart of has exhibited distinct trading behaviors in recent months. Notably, the asset displayed a

The NASDAQ 100 Index is under technical scrutiny with recent movements indicating a potential shift in
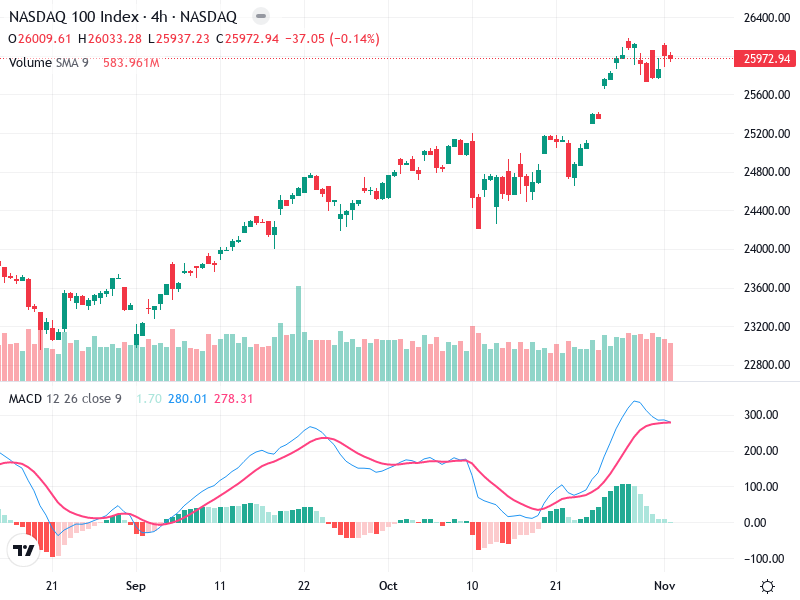
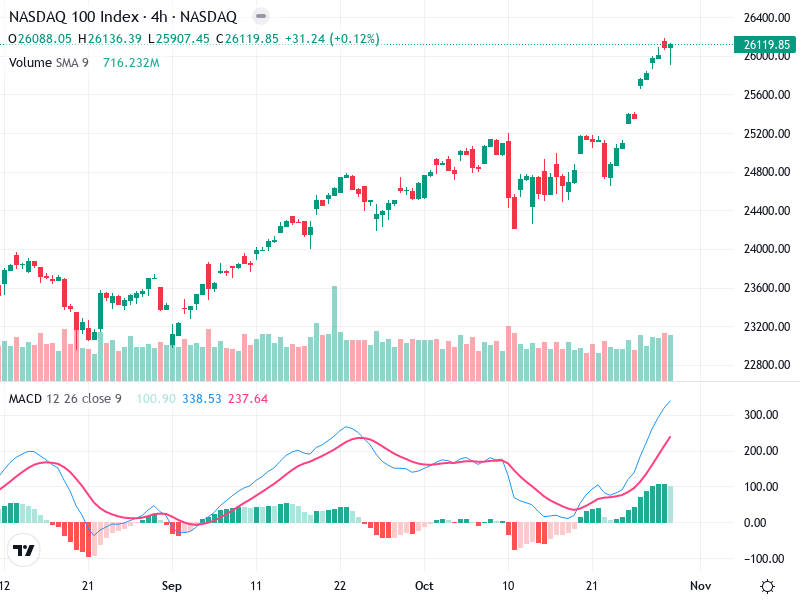
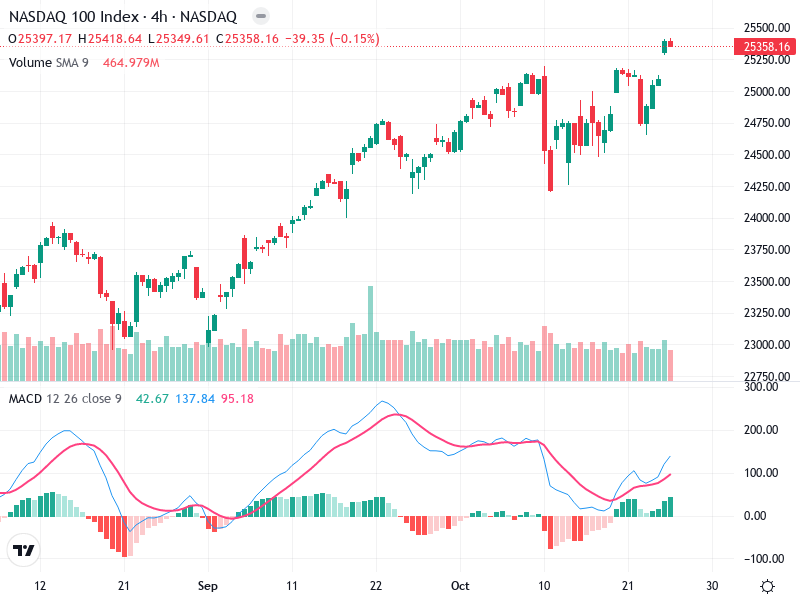
The NASDAQ 100 Index is currently showing signs of a bullish trend with potential for continuation.
The NASDAQ 100 index has shown a strong bullish trend recently, breaking above key resistance levels.
The chart analysis for the asset offers insights into current market dynamics. Observations indicate critical levels
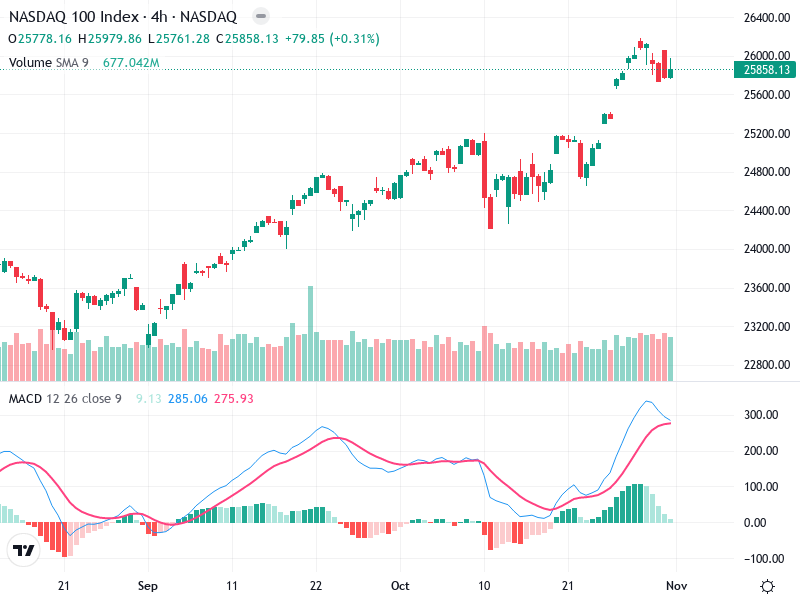
The NASDAQ 100 Index presents a robust bullish setup, driven by consistent upward movements in the
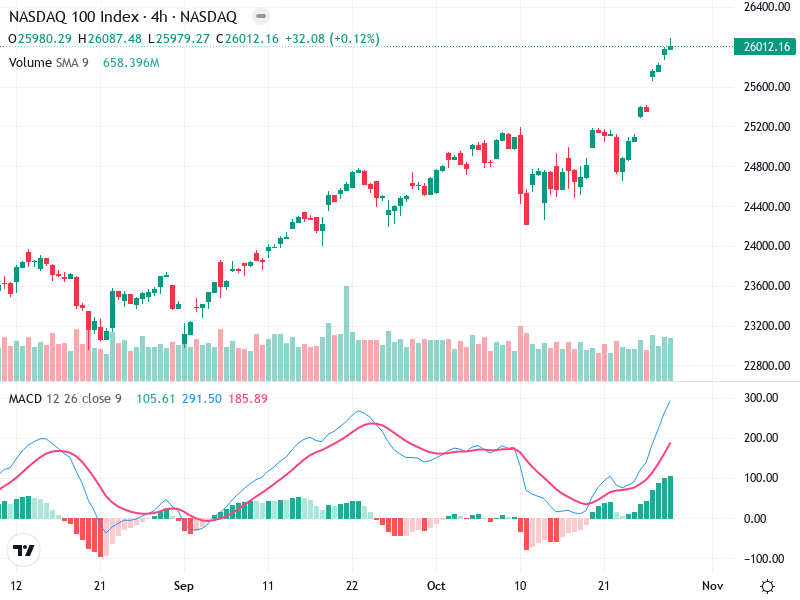
The chart of shows a strong uptrend. Recent price movements indicate a bullish outlook. The asset
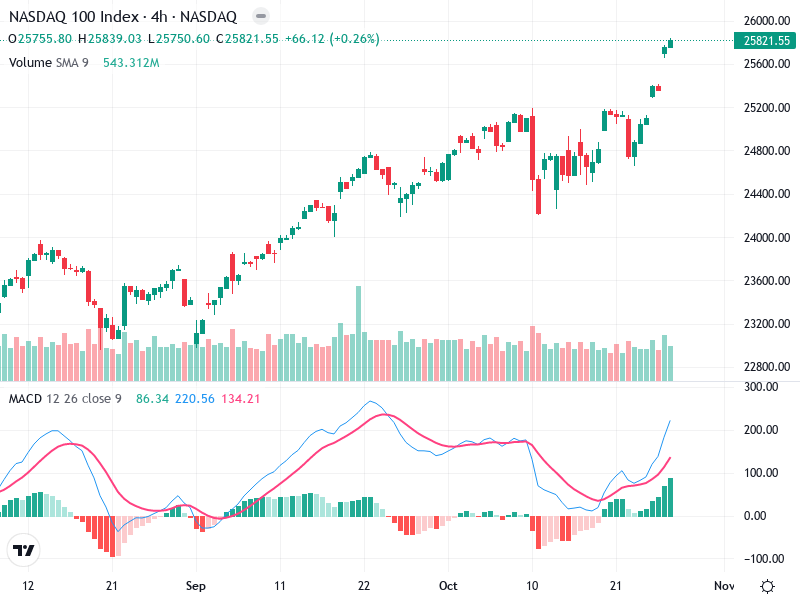
The NASDAQ 100 Index is showing strong bullish signals. Recent technical indicators suggest continued upward momentum.
This chart demonstrates the technical aspects of the asset’s recent performance. Observations suggest a clear trend
